CSEC
Information Technology
Here we have a detailed summary of the complete CSEC Information Technology Syllabus:
The syllabus is organized under eight main sections.
Section 1 | COMPUTER FUNDAMENTALS AND INFORMATION PROCESSING |
Section 2 | COMPUTER NETWORKS AND WEB TECHNOLOGIES |
Section 3 | SOCIAL AND ECONOMIC IMPACT OF INFORMATION AND COMMUNICATIONS TECHNOLOGY (ICT) |
Section 4 | WORD-PROCESSING AND WEB PAGE DESIGN |
Section 5 | SPREADSHEETS |
Section 6 | DATABASE MANAGEMENT |
Section 7 | PROBLEM-SOLVING AND PROGRAM DESIGN |
Section 8 | PROGRAM IMPLEMENTATION |
Section One - COMPUTER FUNDAMENTALS AND INFORMATION PROCESSING
Computer Fundamentals
Concept of Information Technology
Definition of Information Technology
Information Technology (IT) is the application of computers, networking and other hardware, infrastructure and processes to create, process, store, safeguard and transmit all types of electronic information. Normally, IT is applied in the frame of corporate activities (rather than individual and entertainment technologies). Commercial exploitation of IT includes computer technology (hardware and software) as well as telecommunications.
Scope of Information Technology
Hardware and Infrastructure
This includes the physical components (hardware), the service systems (operating systems), and data storage components involved in the functioning of a computer system.
IT hardware can include:
- Computers: personal computers, servers, laptops.
- Peripherals: keyboards, mice, printers.
- Networking hardware: routers, modems.
- Data storage: SSDs, hard drives, USB flash drives.
Software and Applications
Software, which includes programs and operating systems, is used on computers and mobile devices. Types of software include:
- System software: Operating systems like Windows, macOS, Linux.
- Application software: Applications with focused functionality such as Microsoft Office or Adobe Photoshop.
- Development software: Technologies employed to develop, test, and manage software, such as programming languages and frameworks, (e.g., Python, Java, “.NET”.
Telecommunications and Networking
This: technologies which enable the movement of information in space by electric methods, which are:
- Internet connectivity and broadband services.
- Network infrastructure including LANs (Local Area Networks), WANs (Wide Area Networks) and WLANs (Wireless Local Area Networks).
- Communication systems like emails, VoIP (Voice over Internet Protocol), and video conferencing.
Database Management
Databases and database management systems play an essential role in allowing organizations to structure, store, and analyze data effectively. This includes:
- Relational databases like MySQL, Oracle.
- NoSQL databases like MongoDB, Cassandra.
- Data warehousing and data mining technologies.
Information Security
The process of safeguarding information so that it is not subject to unauthorized access/use/disclosure, removal, alteration or destruction to ensure confidentiality, integrity, and availability. Key areas include:
- Cybersecurity measures.
- Encryption technologies.
- Network security applications.
Web Development
The creation and maintenance of websites, which involves web design, web content development, client-side/server-side scripting, and network security configuration. Technologies in this field include:
- HTML, CSS, JavaScript.
- Web frameworks, e.g., Django, Ruby on Rails, and React.
- CMS (Content Management System) like WordPress, Joomla.
IT Support and Services
These are the processes and activities involved in designing, developing, providing and sustaining IT services. This includes:
- Technical support and troubleshooting.
- IT maintenance and updates.
- User training and assistance.
Emerging Technologies
With the development of IT, new technologies appear and change the landscape of the industry such as:.
- Artificial Intelligence and Machine Learning.
- Blockchain technology.
- Internet of Things (IoT).
- Big Data Analytics.
Conclusion
Information Technology plays a pivotal role in the modern era, influencing various aspects of day-to-day activities and driving innovation across multiple sectors. The scope of IT is expansive and continually evolving, touching upon virtually every facet of modern life, from education and healthcare to business and government. It is essential that students, professionals, and the wider population have an appreciation of the foundations and practices of IT to enable them to cope with and thrive during this digital era.
Introduction to Computers
Definition of a Computer:
A computer is an electronic computer that processes information or data. It can serve as a data storage, retrieval, and processing device.
You can use a computer to write papers, write email, play games, and surf the internet. It can also be used for working with spreadsheets, presentations and even editing videos. In fact, a computer is able to complete tasks and calculations according to a collection of rules trapped in its memory, leading it to become one of the most important tools in any of the fields and companies.
Detailed Analysis of Major Types of Computer Systems
Supercomputers
Definition and Use-Cases: Supercomputers are the apex predators of the computing world. They are sophisticated, optimized and very powerful machines, built to give realistic results to the complexity of the most demanding accuracy and detailed calculations that many computers are not able to achieve, like weather forecasts, climate studies, physical simulations, and cryptography analyses.
Processing Speed: Supercomputers have incredible processing speeds that can perform such for compound numbers of the calculation per second (quadrillions). This brute force is made possible by the employment of thousands of processors that are interleaved and coordinate with each other.
Storage Capabilities: Storage on supercomputers is tremendous in size, for the purpose of processing huge amounts of data produced and consumed for simulations. It employs a threo uniq syatem of high-performance RAM for fast data retrieval and big storage pools for data persistence.
Portability: These machines are housed in dedicated facilities; their size and power requirements make them inherently immobile.
Mainframes
Definition and Use-Cases: Mainframes are powerful computers used primarily by large organizations for critical applications, supporting thousands of users simultaneously. They are widespread in government, financial, and big corporation settings on processing large amounts of data.
Processing Speed: Mainframes handle large volumes of data very effectively using optimized CPUs and its strong I/O (input/output) characteristics. They are intended to be throughput and reliable but are not optimized for raw processing speed.
Storage Capabilities: They usually include very large disk storage arrays with high redundancy and backup, to guarantee the data integrity and the possibility of data retrieval.
Portability: Mainframes are fixed by their size and by energy and cooling needs.
Desktop Systems
Definition and Use-Cases: Desktop computer is a powerful system with personal and professional applications. They are suitable for tasks ranging from document creation and accounting to more demanding operations like graphic design and software development.
Processing Speed: Contemporary desktops have a broad range of processing power, and high-performance systems, including gaming systems and professional media editing systems, are possible.
Storage Capabilities: Desktops are configurable with varying storage options, from standard hard drives to fast SSDs, typically offering more storage capacity than portable devices.
Portability: Although not drafted for mobility, PCs can be moved, however, they need an external power supply and peripheral devices in order to be used.
Mobile Devices
Definition and Use-Cases: This group includes portable devices for mobility and portability, e.g., laptops, smartphone, tablets, and portable gamers. They are employed for both entertainment, communication, and portable office work.
Processing Speed: They are designed for energy efficiency and portability, but not for maximum processing power. Nevertheless, the power of contemporary mobile terminals is growing exponentially and thereby able to perform tasks previously only accessible when working with desktops.
Storage Capabilities: Mobile devices have on-board storage which is, in general non-expandable, but many have the ability to use cloud based storage as an add-on service.
Portability: They are highly portable, designed to be lightweight and to operate for hours on battery power.
Embedded Devices
Definition and Use-Cases: Computer systems embedded in other systems to implement control functionality within those systems. They exist in an enormous variety of platforms, ranging from domestic appliances to highly complex tools in industry.
Processing Speed: These devices are all specialized to the control of the device(s) that they manage, typically with only sufficient computing power to carry out their intended functions.
Storage Capabilities: Storage in embedded systems is usually very low, to a firmware and little data logs, or operational parameters.
Portability: Embedded devices on their own are not portable but are integral parts of other portable or stationary devices.
Conclusion
Computers play an important role in everyday life everywhere, from powering home appliances, to enabling complex computations on supercomputers. Every computer system type has been engineered with certain objectives, ranging from maximum portability in mobile devices to maximum computational power in supercomputers used for scientific computations. This spectrum of computing power illustrates the diversity and specialized nature of current technology, tailored to a wide array of tasks and environments.
Major Hardware Components of a Computer System
A computer system consists of a number of hardware elements which function in series to do the computational tasks necessary for computation. The main components include:
Input Devices
Input devices enable the user’s communication of information to the computer for processing.
These include:
- Keyboard: A device used for typing text into the computer. It has keys for letters, numbers, function keys, and special characters.

- Mouse: A device used for interaction via visual elements on the screen.

- Scanner: An apparatus that turns printed matter into digital representation for storage or editing.
- Microphone: Used to capture audio inputs for processing.

- Camera: Images or video) that can be either processed or stored.

- Touchpad/Touchscreen: A device, built in to laptops or mobile computers, that enables users to directly interact with a display.

Central Processing Unit (CPU)
The CPU is commonly called the “brain” of the computer. It executes program control instructions by performing elementary arithmetic, logic, control, and input/output operations. The CPU has three main components:
- Control Unit (CU): Controls the operation of the processor, both in the process of fetching instructions, and for the movement of data between the CPU and the memory.
- Arithmetic Logic Unit (ALU): Carry out mathemtization tasks such as addition, subtraction, multiplication and boolean operations.
- Registers: Fast small-sized storage devices, which are used for the temporary storage of data, during its processing.
Primary Memory (RAM and ROM)
Memory from the primary words, referred to as main memory, contains information that is actively being used by the CPU at the moment.
There are two main types:
- Random Access Memory (RAM): Temporary memory that is used to hold data which is currently processed. The data in RAM is destroyed when the PC turns off.
- Read-Only Memory (ROM): Permanent memory, where basic system instructions and unchanging data are stored. ROM is used for the boot process and remains intact even after the system is powered off.
Secondary Storage
Secondary storage devices offer data storage for durations greater than current memory and are not directly available from the CPU. These devices include:
- Hard Disk Drive (HDD): Magnetic storage device for high density, nonvolatile data storage. HDDs are widely employed for management of operating systems, applications, and user data.

- Solid-State Drive (SSD): An accelerated analog to HDDs, SSDs store data using flash memory. They are more stable and do not have moving parts and thus are faster and more robust.

- Magnetic Tape: Magnetic tapes are commonly employed for archival storage and for the backup and large data storage of information.

- Flash Drives: Handheld portable storage media, relying on flash memory of the NAND type for data storage. They are commonly used for transferring files between computers.

- Memory Cards: Small storage devices used in cameras, smartphones, and other portable devices. They are available in various forms, including SD cards, microSD cards, and CF cards.

- Optical Disks (CD, DVD, Blu-ray): Optical disks are devices for data storage, recognisable by laser. CDs, DVDs, and Blu-ray disks also are media storage devices, including music, movies, and application software distribution.

Output Devices
Output devices are used to display or output the data processed by the computer.
These include:
- Monitor: Displays the visual output of the computer, including text, images, and video.

- Printer: Produces a hard copy of digital documents and images. Printers can be inkjet, laser, or thermal-based.

- Speakers/Headphones: Devices outputting sound from computer users’ point of view, presenting sounds or music to the user’s ears.

How the major hardware components of a computer system interrelate in the Input-Processing-Output-Storage (IPOS) cycle.
1. Introduction to the IPOS Cycle
The Input-Processing-Output-Storage (IPOS) cycle forms the basis upon which computers work. The cycle defines the sequence of steps that a computer takes to receive, decode, store, and transmit data. The main hardware components for this cycle are input devices, processing hardware, storage units, and output devices. These components interact synergistically to accomplish the tasks of the system.
2. Input Stage
The data input stage is that in which information gets inputted in the computer system either by the operator or from outside. Such data may be in various types such as text, images, audio, video or sensor data. Input devices enable communication between the human and the computer.
These include:
- Keyboard: Used to type text or commands.
- Mouse: Allows interaction with graphical elements.
- Scanner: Converts physical documents into digital format.
- Microphone: Captures sound input.
- Camera: Captures images or video for processing.
- Touchpad or Touchscreen: Enables direct input through gestures or by touching the screen.
Data inputted by means of these devices is transmitted to the central processing unit (CPU) for its processing.
3. Processing Stage
The stage of processing is performed by central processing unit (CPU) which is known as brain of computer. The CPU consists of the following sub-components:
- Control Unit (CU): Control and coordination of the instructions received from input devices, as well as the data retrieval from memory that must be provided for processing, is managed and coordinated.
- Arithmetic Logic Unit (ALU): This is the one responsible for the mathematical operations (addition, subtraction), as well as the logical operations (comparisons).
- Registers: Intermediate storage areas of the CPU that contain information to be processed or utilized by the ALU.
After the input data is delivered to the CPU, the control unit restructures it, and the ALU then implements the requested operations on those data. The output may then be sent to an output device (i.e., displayed) or to storage for later retrieval.
4. Output Stage
The output stage is the point when a result of processing is presented or outputted from the system to the user. The processed data, now in ready form, is conveyed by output devices.
These include:
- Monitor (Display): Outputs visual results, such as text, images, or video.
- Printer: Outputs a hard copy of documents or images.
- Speakers: Output audio information, such as music or voice.
- Projector: Displays visual output on a large screen.
The output stage finishes the cycle by delivering such processed information to the user in a questionable way, either visually, auditorily, or to print.
5. Storage Stage
Primary and Secondary.
Primary Storage (Temporary Storage)
- RAM (Random Access Memory): Used for the storage of the actively processed data by the CPU in a temporal manner. Data stored in RAM is wiped out when the system is switched off.
- ROM (Read-Only Memory): Stores essential instructions needed to start the system. This data is non-voluminous and survives the off power state.
Secondary Storage (Permanent Storage)
- Hard Disk Drive (HDD): Used for permanent storage of data and programs. It has high capacity but relatively low access speed.
- Solid-State Drive (SSD): An alternative to HDDs, much faster storage device in which data is to be stored and accessed are based on flash memory as opposed to storage media based on hard disks.
- Optical Disks (CDs, DVDs, Blu-ray): Used for storing the media of movies/music/applications etc.
- Flash Drives and Memory Cards: Portable storage devices, which can be used for data transfer between systems.
Data is stored on these devices so that information can be accessed or updated at any subsequent time of use to be advantageous to the system.
6. The Interrelation of the Components in the IPOS Cycle
All the hardware components are related to each other in the IPOS cycle to execute the computing task efficiently. Here’s how they work together:
1. Information flows into the system through input devices (e.g., keyboard, mouse, scanner).
- Input devices output unprocessed raw data to the CPU for computation.
2. Data is processed by the CPU through its control unit and arithmetic logic unit.
- The control unit executes the process by retrieving instructions from memory.
- The ALU is used to calculate or to do logic operations on the data.
3. After processing, the data stream is delivered to an output device (e.g., screen, printer).
- The outcome of the processing is shown or printed out for the user’s review.
4. Meanwhile, the data can be saved on storage media (e.g., hard disk, SSD).
- Following the processing, the results are stored on storage devices for later use, or for recording.
These four steps (input, processing, output and storing) are endless, iterative and cyclical. The computer is continuously fed with new input, processes it, displays an output, and saves information.
7. Illustration of the IPOS Cycle
To visualize how the major hardware components interrelate in the IPOS cycle, here’s a simplified diagram:

Explanation of the Diagram:
- Input: The raw data is input into the computer (e.g., through a keyboard, mouse, or scanner).
- Processing: The CPU processes the data (by fetching instructions, performing calculations or logic, and managing data flow).
- Output: The result of the processing is sent to output devices (monitor, printer, speakers) for the user to perceive.
- Storage: The processed data is stored in secondary storage (e.g., hard drives, SSDs, flash drives) for future use.
Conclusion
The IPOS cycle of concepts is a foundational principle in explaining computer system behavior. The hardware that contributes (input devices, processing (CPU) units, output devices, storage) together in a seamless and related way in order to permit the acquisition, processing, display and storage of data.
All components have a different contribution to the cycle, but all have to be incorporated for the computer system to be operated in a good way. The uninterrupted communication between these elements guarantees that the computer may get through a vast amount of different tasks, from basic computations to abstract multimedia computations.
The IPOS cycle is the central part of all Information Technology tasks, and therefore deep insight into how the different components interact is of paramount importance to any Information Technology student.
Introduction to Cloud Storage and Local Storage
Regarding the field of Information Technology, storage is considered the devices and the structures through which data are kept, including files, texts, and software.
Two storage categories are cloud storage and local storage.
- Cloud Storage: This includes the Storage of data on Cloud servers managed by external service providers. Users retrieve data from the internet, and many of those services have the ability to save huge amounts of data without being constrained by on-site physical hardware. Some of the most commonly used types of cloud storage service are Google Drive, Dropbox, iCloud and Microsoft OneDrive.
- Local Storage: This is about storage that exists on real, physical hardware that is physically in the user’s environment, e.g., hard-disk drives (HDDs), solid-state drives (SSDs), USB flash drives, or external hard drives/storage. Unlike cloud storage, local storage is not dependent on the internet for access to data.
Although cloud and local storage systems have the same core function, they are vastly different [regarding] the technology, cost, ease of use and security.
Cloud Storage: Definition and Overview
Cloud storage is an approach to store data on remote servers, which are owned and controlled by service providers. These servers are often spread across different geographical locations, ensuring redundancy and security.
Key Features of Cloud Storage: Key Features of Cloud Storage:
- Accessibility: It is possible for information to be stored in the cloud and retrieved from anywhere around the planet as long as the user has a working internet connection. This has applications when that access is frequent or if access is from a distance.
- Scalability: Cloud service provides flexible subscription so that the user can scale their storage capacity. Users have the ability to begin with a minimal storage space and then effortlessly expand as their data storage needs grow.
- Collaboration: Various cloud based services implement real-time collaboration, in which many users can concurrently edit and share a file. For instance, Google Docs facilitates collaborative writing on the same document among multiple people and hence suited for teams and enterprises.
- Data Redundancy: Data is frequently replicated in multiple locations (data centers) by cloud providers. This redundancy guarantees that data will be safe and accessible if one facility is down.
- Backup and Recovery: Cloud storage often includes automatic backup features. This also easy for users to restore lost data, in case of accidental deletion or hardware failure.
Local Storage: Definition and Overview
Local storage refers to the persistence of data on physical hardware devices that sit directly on top of the user’s computer/network. By far the most commonly used local storage types are hard disk drive (HDD), solid-state drive (SSD), optical media (CDs, DVDs), USB flash drives and memory cards.
Key Features of Local Storage: Key Features of Local Storage:
- Physical Ownership: Using local storage the user has a direct access to hardware and the data stored in it. This provides users with a feeling of comfort, since they physically possess the device containing their data.
- Speed: Local memory usually provides much higher read/write speeds, particularly when solid-state disks (SSDs) are employed. As the storage is on the user device itself, the data can be readily accessed without internet bandwidth limitations.
- No Internet Dependency: In contrast to cloud storage, access to data is not dependent on an internet connection with local storage. This is perfect for users living in areas that have intermittent or no access to the internet.
- Security: Local storage offers a degree of physical protection which cloud storage is not capable of. For example, data stored on a removable hard drive is under the user’s control and can be physically protected (e.g., placed in a safe).
Assessment Criteria for Evaluating Storage Options
In order to compare the advantages of cloud storage and local storage, some key criteria should be taken into account:.
- Capacity
Cloud Storage
Cloud storage services offer virtually unlimited capacity. Users generally start with a fixed amount of storage depending on the subscription plan, and more storage can be easily purchased when this is required. The usable storage space available on the cloud is constrained only by the infrastructure of the provider.
Advantages:
- Scalability: Users have the option of augmenting storage capacity without being restricted by mechanical boundaries.
- No physical space requirements: Users do not need to be concerned about running out of space on their devices or in the house.
Disadvantages:
- Costs increase as storage needs grow. Larger storage plans usually charge a higher monthly or yearly fee.
Local Storage
Local storage capacity is restricted by the physical size of storage media. To cite one example, hard drives and SSDs are limited in their maximum capacity and it is difficult to significantly increase the capacity, if not impossible, without separately purchasing an additional piece of hardware.
Advantages:
- Fixed cost: Subscribers pay one time for the storage device and pay no further expenses.
- No dependency on internet access or service providers.
Disadvantages:
- Limited capacity: Local storage is limited by the storage capacity of the device and hardware upgrade is necessary when more space is required.
- Physical space: It is necessary for users to make sure they have enough physical space in order to accommodate additional storage devices.
- Cost
Cloud Storage
Cloud storage is normally subject to subscription model with monthly or annual charges related to storage capacity and the services offered (e.g., teamwork tools, backup, encryption). There are some cloud providers that provide free tiers with limited storage (eg, 15GB Google Drive), but storage beyond this is paid for.
Advantages:
- No upfront costs: Cloud storage generally requires no significant initial investment. Users pay only for the space they need.
- Flexible pricing: Users can easily scaling the amount of their storage space up or down depending on their pocket money.
Disadvantages:
- Recurring costs: In contrast to local storage, cloud storage is an item that comes with ongoing monthly expenses, and the expenses to increase at some point, particularly for data of large sizes.
- Cost increases as storage requirements grow.
Local Storage
Local storage requires an upfront investment in hardware, such as an external hard drive, SSD, or USB drive. After the purchase no further cost is required, except the renewal of the hardware, if this is necessary.
Advantages:
- One-time cost: No subscription fees are charged after buying a storage device.
- No subscription: Users are not restricted to a service provider as well as a pricing plan.
Disadvantages:
- Initial expense: The cost of the device must be pre-paid and it can be quite expensive for high-capacity devices as an option.
- Costs for upgrades: As storage needs grow, additional devices must be purchased.
- Accessibility
Cloud Storage:
Cloud storage is very convenient as soon as it is connected to the Internet. Information can be retrieved from any device, be it laptop, smartphone, tablet, from different locations and thus, it is the perfect tool for remote work or to disseminate information among others.
Advantages:
- Global accessibility: Patients can access data from any location with internet access.
- Synchronization across devices: Files are automatically synced across devices, ensuring the user has the latest version wherever they are.
Disadvantages:
- Internet dependency: Information is only available when the user has a continuous internet.
- Bandwidth issues: The download and upload of big data files as fast as possible is awkward and inefficient when internet connections are not fast and stable.
Local Storage
Local storage requires no internet connection, and data is always immediately accessible from the device it is stored on. Users can freely retrieve their data from their device without needing to go through external servers.
Advantages:
- Instant access: Data is immediately available when the user turns on his/her device.
- No internet needed: Even without an internet connection, data can be accessed.
Disadvantages:
- Limited access: Data is available only from the device or location that contains the storage device.
- Security Issues
Cloud Storage
Cloud storage security is usually strong, with cloud providers providing encryption and data security mechanisms. Yet, a security threat for cloud storage ultimately resides in the provider’s infrastructure, and vulnerabilities to data leaks or hacking may exist.
Advantages:
- Encryption: Most cloud providers encrypt data while in transit and in at rest to prevent it from being accessed by unauthorised parties.
- Backup and redundancy: Cloud storage often includes automatic backup and multiple copies of the data, providing a safety net in case of failure.
Disadvantages:
- Provider vulnerability: Cloud provider must be able to give users the confidence that it is committed to having the proper security measures in place.
- Risk of data breaches: Data sensitive to the cloud provider may be disclosed if a breach of the cloud provider occurs.
- Privacy concerns: Users may not have full control over where their data is stored or who has access to it.
Local Storage
Local storage provides power to the users regarding their data, making them physically secure the data and also secure it digitally. Users can set up their own encryption methods and store the device in a safe location to prevent theft.
Advantages:
- Full control: The user can physically secure the storage device and implement their own security measures (e.g., encryption, passwords).
- Less exposure to external threats: Local storage is not vulnerable to hacking in the same way it is with cloud storage because it is not directly connected to the network.
Disadvantages
- Risk of physical theft: However, if the storage device is lost and/or/or stolen, the data itself is vulnerable.
- No redundancy: Loss or failure of a local storage device, without the user creating a backup, can lead to irrecoverable loss of data.
Conclusion
Both cloud storage and local storage have their own merits and drawbacks, and the best option depends on the specific needs of the user or organization.
- Cloud Storage is ideal for those who need flexible, scalable storage, with remote access, backup, and collaboration features. It’s particularly useful for businesses or individuals who work with large amounts of data and need to access it from various locations.
- Local Storage is better for users who prioritize fast access, security, and having full control over their data. It’s suitable for storing sensitive information that needs to be kept offline, or for users in areas with poor internet connectivity.
Ultimately, many users opt for a hybrid approach, combining both cloud and local storage to leverage the strengths of both systems. This allows for easy access to data and scalability while ensuring that critical data is safely backed up locally for security and offline access.
Selecting Appropriate Input/Output Devices to Meet the Needs of Specified Applications
Input Devices
Optical Mark Reader (OMR): Optical Mark Reader is a device that scans and reads marks made by humans on documents. It is commonly used in the evaluation of multiple-choice examination papers and surveys. The marks are typically made using pencils or pens, and the OMR detects the presence or absence of these marks in predetermined positions.
Applications:
- Academic exams for grading multiple-choice questions.
- Survey forms for collecting data.
- Lottery or voting systems to record selections.
Character Readers (OCR, MICR): Optical Character Recognition (OCR): OCR technology is used to convert different types of documents, such as scanned paper documents or PDFs, into editable and searchable data. OCR reads typed, printed, or handwritten text and translates it into machine-encoded text.
Applications:
- Digitizing printed texts for editing and searching.
- Automating data entry processes in business.
- Reading mail for sorting and routing in postal services.
Magnetic Ink Character Recognition (MICR): MICR is used primarily by the banking industry for processing checks. The MICR encoding, which includes the bank’s code, account number, and check number, is printed using magnetic ink.
Applications:
- Banking industry for processing checks.
- Document verification and authentication.
Mouse: A mouse is a handheld pointing device that detects two-dimensional motion relative to a surface. This motion is typically translated into the movement of a pointer on a screen, allowing users to interact with a graphical user interface.
Applications:
- Personal and professional computing.
- Graphic design and digital art.
- Gaming.
Joystick: A joystick is an input device that consists of a stick that pivots on a base and reports its angle or direction to the device it is controlling. It is often used to control video games, aircraft, and other machinery.
Applications:
- Gaming consoles and arcade games.
- Control systems for cranes and other machinery.
- Flight simulation and control for aircraft.
Barcode Reader: A barcode reader, or scanner, is a device used to capture and read information contained in a barcode. The barcode reader uses a light source and a sensor to translate the reflected light into digital data.
Applications:
- Retail and inventory management.
- Point of Sale (POS) systems.
- Tracking and managing assets in various industries.
Document Scanner: A document scanner is an input device that converts physical documents into digital format. It captures images or text from paper and converts them into a format that can be stored, edited, and shared electronically.
Applications:
- Digitizing paper documents for electronic storage.
- Optical Character Recognition (OCR) for converting printed text to digital text.
- Sending documents via email or fax.
Light Pen: A light pen is a pointing device that allows users to interact with a computer screen or other display device. It detects the presence of light emitted by the screen and sends signals to the computer to perform actions.
Applications:
- Technical drawing and design.
- Graphic design and digital art.
- Interactive presentations and demonstrations.
Touch Terminals: Touch terminals, such as tablets and POS systems, use touch-sensitive screens to allow users to interact directly with what is displayed. They detect touch and translate it into input commands.
Applications:
- Retail and hospitality industries for POS systems.
- Public information kiosks and ATMs.
- Tablets for personal and professional use.
Voice Response Unit: A voice response unit is a device that interprets and responds to voice commands from users. It typically uses speech recognition technology to process spoken input and provide appropriate responses or actions.
Applications:
- Customer service and support systems.
- Home automation and smart devices.
- Accessibility for individuals with disabilities.
Touch Screens (Tablets, Point of Sale, ATM): Touch screens are input devices that respond to the touch of a finger or stylus. They are commonly used in various devices such as tablets, POS systems, and ATMs.
Applications:
- Tablets for personal and professional use.
- POS systems in retail and hospitality.
- ATMs for banking transactions.
Keyboard: A keyboard is an input device that uses a set of keys to input data into a computer or other devices. It is one of the most common and traditional methods of data entry.
Applications:
- General computing and data entry.
- Programming and coding.
- Gaming.
Digital Camera: A digital camera is an input device that captures photographs and videos in digital format. It uses an electronic sensor to capture light and convert it into digital data.
Applications:
- Photography and videography.
- Documenting and sharing visual content.
- Security and surveillance.
Biometric Systems: Biometric systems use unique physical or behavioral characteristics to identify individuals. Common biometric identifiers include fingerprints, facial recognition, and iris scans.
Applications:
- Security and access control.
- Identification and authentication.
- Time and attendance tracking.
Sensors: Sensors are devices that detect and respond to changes in the environment. They convert physical stimuli, such as temperature, light, or pressure, into electrical signals that can be measured and recorded.
Applications:
- Environmental monitoring and control.
- Automotive systems and industrial automation.
- Smart homes and IoT devices.
Remote Control: A remote control is an input device used to operate a machine or device from a distance. It typically uses infrared or radio signals to send commands to the device being controlled.
Applications:
- Television and home entertainment systems.
- Remote-operated toys and gadgets.
- Industrial and machinery control.
Sound Capture: Sound capture devices, such as microphones, capture audio input and convert it into digital data. They are essential for recording and processing sound.
Applications:
- Audio recording and production.
- Voice recognition and communication.
- Conferencing and broadcasting.
Pointing Devices: Pointing devices, such as trackballs and touchpads, are used to control the position of a pointer on the screen. They provide an alternative to traditional mice for navigating graphical user interfaces.
Applications:
- General computing and data entry.
- Graphic design and digital art.
- Accessibility for individuals with disabilities.
Webcam: A webcam is a digital camera used to capture and stream live video to a computer or the internet. It is commonly used for video conferencing and online communication.
Applications:
- Video conferencing and online meetings.
- Streaming and content creation.
- Security and surveillance.
Visual Output Devices
- Monitors: Monitors are display devices used to present visual information to users. They come in various sizes and types, including LCD, LED, and OLED screens.
Applications:
- General computing and office work.
- Gaming and entertainment.
- Graphic design and video production.
- Printers: Printers are output devices that produce hard copies of digital documents and images. Different types of printers include laser, inkjet, dot matrix, thermal, plotters, and 3D printers.
Laser Printers:
- High-quality printing.
- Fast and efficient for large volumes.
- Commonly used in offices and businesses.
Inkjet Printers:
- High-quality color printing.
- Suitable for home and small office use.
- Often used for printing photos and graphics.
Dot Matrix Printers:
- Impact printing technology.
- Suitable for printing multipart forms and continuous paper.
- Used in industrial and business applications.
Thermal Printers:
- Use heat to print on special paper.
- Commonly used for receipts and labels.
- Found in retail and hospitality industries.
Plotters:
- Large-format printing for technical drawings and graphics.
- Used in architecture, engineering, and design.
3D Printers:
- Create three-dimensional objects from digital models.
- Used in manufacturing, prototyping, and hobbyist projects.
Microfilm: Microfilm is a method of storing documents on film. It provides a high-density storage solution and is commonly used for archiving and preserving records.
Applications:
- Archiving historical documents and records.
- Storing large volumes of data in compact form.
- Libraries and research institutions.
Audible Output Devices
- Speakers: Speakers are output devices that convert electrical signals into sound. They are commonly used in various applications, from personal use to professional audio systems.
Applications:
- Home entertainment and music playback.
- Public address systems and events.
- Audio production and broadcasting.
Headphones and Earphones: Headphones and earphones are personal audio output devices that allow users to listen to audio privately. They come in various designs, including over-ear, on-ear, and in-ear models.
Applications:
- Personal music and media consumption.
- Gaming and virtual reality.
- Professional audio monitoring.
Conclusion
Selecting appropriate input and output devices is crucial for ensuring that specified applications function efficiently and effectively. By understanding the various types of devices and their applications, users can make informed decisions to meet their specific needs.
Roles of Different Types of Software in Computer Operations.
System Software
System software is a type of computer program designed to run a computer’s hardware and application programs. It serves as an interface between the hardware and the end-users. There are two primary types of system software:
Operating Systems and Utility Software.
Operating Systems
An Operating System (OS) is the most critical piece of software on any computer. It manages all other programs on a computer.
- Resource Management:
- Manages the computer’s memory, CPU, and storage resources.
- Ensures that each application gets enough resources to function correctly without interfering with other applications.
- Examples: Memory management, process scheduling, and file system management.
- User Interface:
- Provides a user interface, such as command-line (CLI) or graphical (GUI), that allows users to interact with the computer.
- CLI example: Command Prompt in Windows.
- GUI example: Windows Desktop interface.
- Hardware Control:
- Manages and controls hardware components like processors, memory devices, and peripheral devices.
- Examples: Device drivers, firmware updates.
- File System Management:
- Manages files on the computer, allowing users to create, delete, read, and write files.
- Supports various file systems such as NTFS (Windows), HFS+ (Mac OS), and ext4 (Linux).
- Security and Access Control:
- Provides security features to protect data and restrict access to unauthorized users.
- Examples: User authentication, access controls, encryption.
- System Performance Monitoring:
- Monitors system performance and provides tools to diagnose and optimize it.
- Examples: Task Manager in Windows, Activity Monitor in macOS.
Utility Software
Utility software is designed to help analyze, configure, optimize or maintain a computer.
- Antivirus and Security Programs:
- Protect the computer from malware and other security threats.
- Examples: Norton Antivirus, McAfee.
- Backup Utilities:
- Help in creating copies of data to prevent data loss.
- Examples: Acronis True Image, Windows Backup.
- Disk Management Tools:
- Provide tools to manage disk storage, including partitioning and formatting.
- Examples: Disk Cleanup, Defragmentation tools.
- Performance Monitoring and Optimization Tools:
- Monitor system performance and provide optimization tools.
- Examples: CCleaner, Advanced SystemCare.
- Compression Tools:
- Help compress and decompress files to save storage space.
- Examples: WinRAR, 7-Zip.
- File Management Tools:
- Facilitate file management tasks such as searching, renaming, and deleting files.
- Examples: Windows Explorer, Total Commander.
Application Software
Application software is a program or group of programs designed for end-users. They are divided into two main types: General-Purpose and Special-Purpose.
General-Purpose Application Software
General-purpose application software is designed to perform a range of tasks. These are versatile and widely used for various functions.
- Word Processing Software:
- Used for creating, editing, and formatting text documents.
- Examples: Microsoft Word, Google Docs.
- Spreadsheet Software:
- Used for organizing, analyzing, and storing data in tabular form.
- Examples: Microsoft Excel, Google Sheets.
- Presentation Software:
- Used for creating visual and interactive presentations.
- Examples: Microsoft PowerPoint, Keynote.
- Database Management Software:
- Used for creating and managing databases.
- Examples: Microsoft Access, MySQL.
- Email Clients:
- Used for sending, receiving, and managing email.
- Examples: Microsoft Outlook, Thunderbird.
Special-Purpose Application Software
Special-purpose application software is designed to perform specific tasks.
- Graphics and Design Software:
- Used for creating and editing visual content.
- Examples: Adobe Photoshop, CorelDRAW.
- Accounting Software:
- Used for managing financial accounts and transactions.
- Examples: QuickBooks, Sage.
- Medical Software:
- Used in healthcare for patient management, diagnosis, and treatment.
- Examples: Medisoft, Epic.
- Educational Software:
- Used for teaching and learning purposes.
- Examples: Khan Academy, Blackboard.
- Entertainment Software:
- Used for gaming, music, and video streaming.
- Examples: Spotify, Netflix.
Integrated Software Packages
Integrated software packages are bundles of application software that offer a range of functionalities within a single package. They provide a cost-effective and convenient solution for users who need multiple applications.
- Microsoft Office Suite: Includes Word, Excel, PowerPoint, and Outlook.
- Google Workspace: Includes Google Docs, Sheets, Slides, and Gmail.
Software Sources
Software can come from various sources, each with its unique advantages and considerations.
Off-the-Shelf Software
Off-the-shelf software is pre-made and commercially available to the public.
- Advantages:
- Ready to use immediately.
- Widely tested and supported.
- Cost-effective for many users.
- Examples: Adobe Acrobat, Microsoft Office.
Custom-Written Software
Custom-written software is specifically developed for a particular organization or user.
- Advantages:
- Tailored to specific needs and requirements.
- Can provide a competitive advantage.
- Examples: Custom business management systems.
Customized Software
Customized software is off-the-shelf software that has been modified to meet the specific needs of the user.
- Advantages:
- Combines the benefits of off-the-shelf and custom-written software.
- Cost-effective and tailored to needs.
- Examples: Customized ERP systems.
Conclusion
The roles of different types of software in computer operation are extensive and critical. System software, such as operating systems and utilities, provides the foundation for the computer’s functionality and user interaction. Application software, both general-purpose and special-purpose, enables users to perform a wide range of tasks. Integrated software packages offer a comprehensive solution for multiple needs, while the sources of software—off-the-shelf, custom-written, and customized—provide flexibility in meeting various requirements.
User Interfaces in Information Technology.
Hardware User Interfaces
Touch Screens
Advantages:
Intuitive and Easy to Use: Touch screens are highly intuitive, making them accessible to users of all ages and skill levels.
Space-Saving: They eliminate the need for a physical keyboard and mouse, saving space.
Speed: Direct interaction with the display can speed up tasks.
Versatility: Can be used in various environments, including kiosks, ATMs, and mobile devices.
Accessibility: Beneficial for users with physical disabilities who may find traditional input devices challenging to use.
Disadvantages:
Cost: Generally more expensive than traditional input devices.
Durability: Susceptible to scratches, smudges, and damage from heavy use.
Accuracy: Can be less accurate than a mouse or stylus, especially for detailed tasks.
Ergonomics: Prolonged use can lead to strain on the arms and shoulders.
Maintenance: Requires regular cleaning to maintain functionality and visibility.
Specialized Keyboards
Advantages:
Customization: Can be tailored to specific tasks or user needs, such as gaming, programming, or accessibility.
Efficiency: Specialized keys and macros can speed up repetitive tasks.
Ergonomics: Designed to reduce strain and improve comfort during extended use.
Durability: Often built to withstand heavy use and harsh environments.
Disadvantages:
Cost: Typically more expensive than standard keyboards.
Learning Curve: May require time to learn and adapt to the specialized layout.
Compatibility: Not always compatible with all systems or software.
Bulkiness: Can be larger and heavier than standard keyboards, making them less portable.
Software User Interfaces
Command Line Interface (CLI)
Advantages:
Efficiency: Allows for quick execution of commands and scripts.
Resource Usage: Consumes minimal system resources compared to graphical interfaces.
Flexibility: Highly flexible and powerful, suitable for advanced users and administrators.
Automation: Supports automation of repetitive tasks through scripting.
Disadvantages:
Usability: Steep learning curve for beginners; requires knowledge of specific commands.
Error-Prone: Typing errors can lead to incorrect commands or system issues.
Feedback: Provides limited visual feedback, making it harder to understand errors or results.
Accessibility: Less accessible for users with disabilities compared to graphical interfaces.
Menu-Driven Interface
Advantages:
Ease of Use: Simple and easy to navigate, suitable for beginners.
Consistency: Provides a consistent structure, reducing the learning curve.
Guidance: Guides users through tasks step-by-step, reducing errors.
Accessibility: Can be designed to be accessible for users with disabilities.
Disadvantages:
Speed: Can be slower than other interfaces, especially for experienced users.
Flexibility: Limited flexibility compared to command line or graphical interfaces.
Complexity: Can become cumbersome with too many menu options or levels.
Resource Usage: Requires more system resources than command line interfaces.
Graphical User Interface (GUI)
Advantages:
Intuitive: Highly intuitive and visually appealing, making it accessible to all users.
Multitasking: Supports multitasking with multiple windows and applications.
Feedback: Provides immediate visual feedback, making it easier to understand actions and results.
Accessibility: Can be designed with accessibility features for users with disabilities.
Disadvantages:
Resource Usage: Consumes more system resources than command line interfaces.
Complexity: Can be overwhelming for beginners with too many options and features.
Speed: May be slower for experienced users compared to command line interfaces.
Customization: Limited customization options compared to command line interfaces.
Touch Interface (Software)
Advantages:
Intuitive: Direct interaction with the display is highly intuitive and user-friendly.
Speed: Can speed up tasks with direct manipulation of objects on the screen.
Accessibility: Beneficial for users with physical disabilities who may find traditional input devices challenging to use.
Disadvantages:
Cost: Generally more expensive than traditional input devices.
Durability: Susceptible to scratches, smudges, and damage from heavy use.
Accuracy: Can be less accurate than a mouse or stylus, especially for detailed tasks.
Ergonomics: Prolonged use can lead to strain on the arms and shoulders.
Maintenance: Requires regular cleaning to maintain functionality and visibility.
Evaluating the Suitability of a Computer System for Specific Purposes
Evaluating a computer system’s suitability involves examining several critical specifications, which may vary depending on the intended use of the system. These uses can range from running video games to web browsing, graphic design, video editing, and desktop publishing.
Key Specifications to Consider:
Processing Speed (CPU Type and Speed)
CPU Type: Different CPUs are designed for various tasks. For instance, gaming might require a high-performance CPU like the Intel Core i7 or AMD Ryzen 7, whereas basic web browsing can be handled by more economical options.
CPU Speed: Measured in GHz, higher speeds generally indicate better performance. However, the actual performance can also depend on other factors like the number of cores.
Memory (RAM)
RAM Size: More RAM allows for more applications to run simultaneously without slowing down the system. For instance, video editing and graphic design generally require more RAM (16GB or more) compared to basic tasks like web browsing (4GB or 8GB).
RAM Speed: This can also impact performance, especially in tasks that require rapid data processing.
Secondary Storage (Capacity and Speed)
Storage Capacity: Sufficient storage is crucial for storing files and applications. Video editing and graphic design typically require more storage space compared to web browsing.
Storage Speed: Solid State Drives (SSDs) offer faster data access and are preferable for tasks requiring quick load times, such as gaming or video editing.
Types of Software
Different tasks require different software applications. For example, graphic design often uses software like Adobe Photoshop, while web browsing can be handled by any standard web browser.
Input/Output Devices
Input Devices: These include peripherals like keyboards, mice, and graphic tablets. The requirements for these devices can vary significantly based on the task. Graphic designers may need specialized tablets.
Output Devices: Monitors, printers, and other output devices also vary in necessity based on the task. High-resolution monitors are crucial for graphic design and video editing.
Detailed Explanation:
Processing Speed (CPU Type and Speed):
The CPU, or Central Processing Unit, is often referred to as the brain of the computer. It handles most of the processing tasks and instructions that the computer runs. Evaluating its suitability involves looking at the type of CPU (e.g., Intel vs. AMD) and its speed.
Modern CPUs often have multiple cores, allowing them to handle several tasks at once, which is essential for multitasking. High-performance CPUs like Intel’s Core i9 or AMD’s Ryzen 9 are ideal for demanding tasks such as video editing or gaming due to their high clock speeds and multiple cores.
For less intensive tasks, such as web browsing or office work, a mid-range CPU like the Intel Core i5 or AMD Ryzen 5 would be sufficient. These CPUs offer a good balance between performance and cost.
Memory (RAM):
Random Access Memory (RAM) is the computer’s short-term memory, where data that is actively being used by the CPU is stored for quick access. The amount of RAM needed depends heavily on the task at hand.
For everyday use, such as web browsing, 4GB to 8GB of RAM is usually sufficient. For more demanding applications, like video editing, 16GB or more is recommended. This ensures that the computer can handle large files and multiple applications simultaneously without slowing down.
The speed of RAM, measured in MHz, can also impact performance, particularly in tasks that require rapid data processing, such as gaming or real-time graphic rendering.
Secondary Storage (Capacity and Speed):
Secondary storage is where all the data and files are stored when they are not in use. The main types of secondary storage are Hard Disk Drives (HDDs) and Solid State Drives (SSDs).
HDDs offer large storage capacities at a lower cost, making them suitable for storing large amounts of data, such as media libraries. However, they are slower compared to SSDs.
SSDs are faster and more reliable, making them ideal for tasks that require quick data access, such as gaming or video editing. They are more expensive per gigabyte than HDDs but can significantly improve overall system performance.
For optimal performance, a combination of both can be used: an SSD for the operating system and frequently used applications, and an HDD for mass storage.
Types of Software:
The suitability of a computer system also depends on the type of software it needs to run. Different applications have different system requirements.
For instance, high-end graphic design software like Adobe Photoshop or Illustrator requires a powerful CPU, plenty of RAM, and a high-resolution monitor. In contrast, web browsing only requires a basic CPU, minimal RAM, and any standard monitor.
Input/Output Devices:
Input devices allow users to interact with the computer, while output devices display or output the results of the computer’s processing. The type of input/output devices needed can vary greatly depending on the task.
For example, graphic designers may use a specialized graphics tablet to create digital art, while gamers might use a high-DPI mouse and mechanical keyboard for better control and responsiveness.
Output devices such as monitors and printers also vary in quality and suitability. Graphic designers and video editors often require high-resolution monitors with accurate color reproduction, while a standard monitor is sufficient for web browsing and office work.
Conclusion: Evaluating the suitability of a computer system for a specific purpose involves considering several key specifications, including CPU type and speed, RAM size and speed, storage capacity and type, software requirements, and input/output devices. Each of these factors can impact the overall performance and efficiency of the system for different tasks.
Troubleshooting Basic Computer Hardware Problems.
Cable Problems
Loose Cables
This is one of the most common issues and can cause various problems, including no power, intermittent connections, or peripherals not being recognized.
Symptoms:
Devices not working or disconnecting randomly.
No power to the computer or peripherals.
Solutions:
Ensure all cables are securely connected to both the device and the power source.
Check for any visible damage to the cables.
Use cable management solutions to prevent cables from becoming loose due to movement or tugging.
Preventative Measures:
Regularly check and secure cables.
Avoid placing cables in high-traffic areas where they may be disturbed.
Monitor Problems
Improperly Adjusted Monitor Controls
Incorrect monitor settings can lead to display issues such as poor resolution, incorrect colors, or no display at all.
Symptoms:
Blurry or pixelated images.
Incorrect color display or brightness.
Monitor not turning on or no display.
Solutions:
Adjust the monitor settings using the buttons on the monitor or through the display settings on the computer.
Check the resolution settings on the computer to ensure they match the monitor’s native resolution.
Ensure the monitor is connected to the correct port on the computer.
Preventative Measures:
Regularly calibrate the monitor.
Avoid changing the settings frequently unless necessary.
Printer Problems
Changing Printer Cartridges
Printer issues can range from paper jams to low ink or toner levels, but one of the most common problems is needing to change the printer cartridges.
Symptoms:
Poor print quality (faded, streaked, or blank pages).
Printer displaying low ink/toner warnings.
Printer not printing at all.
Solutions:
Follow the manufacturer’s instructions to replace the ink or toner cartridges.
Ensure the cartridges are correctly installed and seated properly.
Run the printer’s maintenance functions, such as print head cleaning.
Preventative Measures:
Regularly check ink or toner levels.
Use the printer’s maintenance functions regularly to keep it in good working condition.
Battery Problems
Loose or Dead Battery
Battery issues can affect laptops and other portable devices, leading to power problems.
Symptoms:
Device not turning on or shutting down unexpectedly.
Battery not charging or holding a charge.
Solutions:
Ensure the battery is securely connected to the device.
Replace the battery if it is old or no longer holding a charge.
Check the power adapter and charging port for any issues.
Preventative Measures:
Regularly check and maintain the battery and charging components.
Replace the battery periodically as per the manufacturer’s recommendations.
Expanded Notes on Troubleshooting Techniques
Diagnosing Hardware Issues
Visual Inspection
Inspect hardware components for visible signs of damage, wear, or improper connections.
Look for bent pins, burnt components, or loose cables.
Listening for Error Beeps
Many computers provide audio cues in the form of error beeps during startup. These beeps can help diagnose issues, as different beep patterns correspond to different hardware problems.
Consult the motherboard’s manual or manufacturer’s website for the beep code interpretations.
Using Diagnostic Software
Utilize built-in or third-party diagnostic tools to test hardware components such as RAM, hard drives, and graphics cards.
Run software utilities like Windows Memory Diagnostic, CrystalDiskInfo, or manufacturer-specific tools.
Handling Common Hardware Issues
Boot Issues
Symptoms: Computer not starting, displaying error messages, or freezing during boot.
Possible Causes: Faulty power supply, damaged boot sector, or failing hardware components.
Solutions:
Check power supply connections and functionality.
Boot into safe mode or use recovery tools to fix boot issues.
Test hardware components individually to identify faulty parts.
Overheating
Symptoms: Computer shutting down unexpectedly, high fan speeds, or excessive heat.
Possible Causes: Dust buildup, inadequate cooling, or failing fans.
Solutions:
Clean dust from internal components using compressed air.
Ensure proper airflow by organizing cables and adding additional cooling solutions if necessary.
Replace failing fans or thermal paste on the CPU.
Peripheral Device Issues
Symptoms: Devices such as mice, keyboards, or external drives not working.
Possible Causes: Driver issues, faulty connections, or device malfunctions.
Solutions:
Update or reinstall drivers.
Check and secure connections.
Test the device on another computer to rule out hardware failure.
Preventative Maintenance Tips
Regular Cleaning
Dust and debris can cause overheating and component failure. Regularly clean the computer’s internal components to ensure proper ventilation.
Software Updates
Keep the operating system and drivers up to date to ensure compatibility and stability. Regular updates can also address known issues and security vulnerabilities.
Backup Data
Regularly back up important data to avoid data loss due to hardware failures. Use external drives, cloud storage, or other backup solutions.
Environmental Considerations
Place the computer in a cool, dry, and stable environment to prevent overheating and physical damage. Avoid exposing the computer to extreme temperatures, moisture, or direct sunlight.
Advanced Troubleshooting Techniques
Using Safe Mode
Safe mode is a diagnostic mode that loads only essential drivers and services. It can help isolate software-related issues.
To enter safe mode, restart the computer and press the appropriate key (often F8 or Shift+F8) during boot.
System Restore
System restore allows you to revert the computer’s state to a previous point in time. It can help resolve issues caused by recent changes or software installations.
Access system restore through the control panel or advanced startup options.
Hardware Replacement
When troubleshooting indicates a hardware component is failing, replacing the component may be necessary.
Ensure compatibility and follow proper installation procedures to avoid further issues.
INFORMATION PROCESSING FUNDAMENTALS
Distinguishing Between Data and Information
Definitions
Data: Data refers to raw, unprocessed facts and figures. It represents the primary building blocks of information and is often considered meaningless without context. Data can take many forms, including text, numbers, symbols, and multimedia.
Information: Information is processed data that has been organized, structured, or presented in a given context to make it meaningful and useful. It provides insights, answers questions, and supports decision-making. Information adds value by transforming raw data into a format that can be understood and applied.
Sources of Data and Information
Data and information can be sourced from various origins, including:
People: Human sources are a rich repository of data and information. Examples include surveys, interviews, observations, and experiences shared by individuals. People provide subjective insights, preferences, and qualitative data that can be analyzed and processed.
Places: Geographic locations and physical environments can offer valuable data. Sources include geographic information systems (GIS), maps, climate data, and land surveys. Places provide contextual data about location, weather patterns, and environmental conditions.
Things: Objects and devices generate data through sensors, machines, and technology. This includes Internet of Things (IoT) devices, machinery, vehicles, and other physical objects. Things produce quantitative data such as temperature readings, motion sensors, and machine status.
Document Types
Different types of documents present data and information in various formats. Key document types include:
Turnaround Documents: These are documents sent from one organization to another and then returned with updated or new information. They are designed to capture, store, and process transactional data efficiently. Examples include bills, receipts, and feedback forms.
Human-Readable Forms: Documents that are easily understood and interpreted by people. These include printed reports, books, manuals, and letters. Human-readable forms present data in a visually accessible manner, often using natural language.
Machine-Readable Forms: Documents formatted for computer processing. Examples include barcodes, QR codes, XML files, and electronic data interchange (EDI) formats. Machine-readable forms enable automated data capture and processing, reducing errors and increasing efficiency.
Hard Copy: Physical printed documents, such as paper reports, books, and printed manuals. Hard copies offer tangible records that can be stored, shared, and reviewed without electronic devices.
Soft Copy: Digital documents stored electronically, such as PDFs, Word documents, spreadsheets, and multimedia files. Soft copies are easily stored, shared, and edited, and they provide flexibility in accessing and managing information.
Conclusion
Understanding the distinction between data and information is crucial in Information Technology. Data serves as the raw material that, when processed, becomes meaningful information. By recognizing the sources of data and information and the different types of documents, individuals can effectively manage and utilize these assets in various applications. These foundational concepts underpin the broader field of Information Technology, influencing how we collect, process, and apply data to solve problems and make informed decisions.
Evaluating the Reliability of Information Obtained from Online Sources
The digital age has revolutionized how information is disseminated and accessed. The vast quantity of information available online is both a blessing and a curse; while it offers unprecedented access to knowledge, it also presents challenges in discerning credible and reliable information from false or misleading content. This section aims to equip you with the skills to evaluate online information effectively.
Authenticity
Authenticity refers to the genuineness of the information and its source. To evaluate authenticity, consider the following:
Source Identification: Determine who authored the information. Is it published by a reputable organization, an academic institution, or a recognized expert in the field?
Author Credentials: Evaluate the qualifications and expertise of the author. Are they known in the field? Do they have relevant experience or academic qualifications?
Publication Venue: Check where the information is published. Credible sources include academic journals, official websites of institutions, or reputable news organizations.
Citation and References: Authentic information is usually supported by citations and references. Verify the sources cited to ensure they are reputable and reliable.
Domain Check: Trustworthy domains often end in .edu, .gov, or .org. Commercial websites (.com) can also be reliable, but caution is advised as they may have commercial interests.
Currency
Currency pertains to the timeliness of the information. In rapidly evolving fields, up-to-date information is crucial. Assess currency by considering:
Publication Date: Check the date when the information was published or last updated. Recent information is generally more reliable, especially in dynamic fields like technology and medicine.
Relevance of Time-Sensitive Information: For topics influenced by recent developments, ensure the information reflects the latest research or events.
Ongoing Updates: Reliable sources often update their content regularly to reflect new findings or changes.
Relevance
Relevance involves assessing whether the information is pertinent to your needs. To determine relevance:
Purpose: Identify if the information meets your objectives. Is it aimed at providing an overview, detailed analysis, or opinion?
Audience: Consider the target audience of the information. Is it geared towards academics, professionals, or the general public? The complexity and depth of information should match your needs.
Depth and Breadth: Evaluate if the information covers the topic comprehensively. Does it provide the necessary depth or is it too superficial?
Context: Assess if the information is presented in the right context. Does it address your specific question or problem?
Bias
Bias refers to a prejudiced or partial viewpoint. Identifying bias ensures the information is balanced and objective. Consider the following:
Author’s Perspective: Recognize the author’s viewpoint. Are they presenting facts or opinions? Do they have a potential conflict of interest?
Language and Tone: Analyze the language used. Is it neutral, or does it show bias through emotionally charged words or persuasive techniques?
Balanced Coverage: Check if the information presents multiple viewpoints. Reliable sources often provide a balanced perspective or acknowledge different opinions.
Funding and Sponsorship: Investigate if the content is sponsored or funded by an entity with vested interests. Sponsored content may be biased to favor the sponsor’s perspective.
Practical Strategies for Evaluating Online Information
Here are some actionable steps to help evaluate the reliability of online information:
Cross-Verification: Cross-check information with multiple sources to ensure consistency and accuracy.
Fact-Checking Websites: Use fact-checking websites like Snopes, FactCheck.org, or PolitiFact to verify claims.
Critical Reading: Read critically, questioning the motives, credentials, and reliability of the source.
Using Tools: Leverage tools like Google Scholar for academic articles or domain-specific databases for specialized information.
Community Feedback: Check user reviews, comments, or ratings if applicable. Community feedback can provide insights into the credibility of the information.
Case Studies
To illustrate the application of these principles, let’s examine a few case studies:
Case Study 1: Evaluating a Health Blog
Authenticity: The blog is written by a licensed nutritionist with credentials and references cited.
Currency: The post was updated within the last six months, reflecting recent studies.
Relevance: The content matches your research on dietary supplements.
Bias: The blog discloses sponsorship by a supplement company, raising potential bias concerns. However, the information is cross-verified with other independent sources.
Case Study 2: Assessing a News Article on Climate Change
Authenticity: Published by a major news organization with a strong track record.
Currency: Article includes recent data and interviews with experts.
Relevance: Provides comprehensive coverage of current climate policies.
Bias: The article quotes multiple experts from different fields, ensuring a balanced perspective.
Conclusion
Evaluating the reliability of online information is an essential skill in the digital age. By considering the authenticity, currency, relevance, and bias of the information, you can make informed decisions and avoid being misled. Use the practical strategies provided to hone your evaluation skills and become a discerning consumer of online information.
Data Validation and Verification in Information Technology
In the field of Information Technology, ensuring data accuracy and reliability is crucial. Two critical processes for this are validation and verification. Although often used interchangeably, they serve different purposes and are applied at different stages of data management. This document aims to provide an in-depth understanding of these two processes, their differences, and their significance.
Defination
Validation:
Validation is the process of evaluating whether data input into a system meets the required criteria and specifications.
It ensures that data is accurate, complete, and correctly formatted before it is processed or used.
Verification:
Verification is the process of checking that the data has been accurately and correctly entered into the system.
It involves confirming that the data matches the original source and has not been altered or corrupted during entry or transmission.
Purpose
Validation:
The primary purpose of validation is to ensure data is suitable for its intended use.
It checks for data quality, consistency, and compliance with predefined rules and standards.
Verification:
The purpose of verification is to ensure the integrity and accuracy of data.
It aims to detect and correct errors that may have occurred during data entry or transmission.
Timing
Validation:
Typically performed at the point of data entry or before data processing.
Acts as a gatekeeper to prevent invalid data from entering the system.
Verification:
Usually conducted after data entry or transmission.
A post-entry check to ensure data remains accurate and unaltered.
Methods
Validation Methods:
Format Checks: Ensuring data is in the correct format (e.g., date format, email format).
Range Checks: Ensuring data falls within a specified range (e.g., age between 0 and 120).
Consistency Checks: Ensuring data is consistent with other related data (e.g., start date is before end date).
Presence Checks: Ensuring mandatory fields are not left blank.
Verification Methods:
Double Data Entry: Entering data twice and comparing the entries for discrepancies.
Checksums and Hashing: Using mathematical algorithms to detect changes in data.
Manual Review: Manually comparing data against the original source.
Automated Tools: Using software tools to compare data against predefined criteria.
Examples
Validation Examples:
Ensuring a user’s email address is in the correct format before allowing them to register on a website.
Checking that a product’s price is within a reasonable range before adding it to an inventory system.
Verification Examples:
Comparing a printed invoice against the original order to ensure all details match.
Using checksums to verify that a file has not been corrupted during download.
Importance
Validation:
Validation is crucial for maintaining data quality and preventing errors from propagating through the system.
Ensures that only accurate and relevant data is processed, reducing the risk of incorrect decisions based on faulty data.
Verification:
Verification is essential for maintaining data integrity and trustworthiness.
Helps detect and correct errors that may have occurred during data entry or transmission, ensuring data remains reliable and accurate.
Challenges
Validation Challenges:
Designing comprehensive validation rules that cover all possible data scenarios.
Balancing strict validation criteria with user convenience to avoid frustrating users with overly restrictive rules.
Verification Challenges:
Ensuring verification processes are thorough without being overly time-consuming.
Implementing effective verification methods for large volumes of data.
Tools and Technologies
Validation Tools:
Data validation tools integrated into data entry forms and applications.
Custom scripts and algorithms for specific validation requirements.
Verification Tools:
Data verification software and tools that automate the comparison of data against original sources.
Cryptographic techniques like checksums and hashing for data integrity verification.
Best Practices
Validation:
Implement validation at the earliest possible stage to prevent invalid data from entering the system.
Regularly review and update validation rules to adapt to changing requirements.
Verification:
Conduct regular verification checks to ensure ongoing data integrity.
Use a combination of automated and manual verification methods for comprehensive coverage.
Conclusion
Both validation and verification are critical components of data management in Information Technology. Validation ensures that data meets required criteria and is suitable for its intended use, while verification ensures data integrity and accuracy. Implementing effective validation and verification processes helps maintain data quality, prevent errors, and ensure reliable data for decision-making.
Validation Methods
Validation ensures that data entered into a system meets specific criteria before it’s processed. Below are the key methods:
1. Range Check
A range check verifies that a data entry falls within a predetermined range. This is crucial for numerical data to ensure it’s realistic and within acceptable limits. For example, in a system storing ages, a range check might ensure ages are between 0 and 120.
2. Reasonableness Check
A reasonableness check evaluates whether the data entered is logical and makes sense within the context. For instance, if an employee’s salary is entered, a reasonableness check might flag any amounts that are unusually high or low based on the company’s pay scale.
3. Data Type Check
Data type checks ensure that the data entered is of the correct type. For example, a system might require numerical data for a phone number and will not accept alphabetic characters or symbols.
4. Consistency Check
Consistency checks ensure that data entries are logically consistent with each other. For example, if a form requires both a start date and an end date, a consistency check would ensure that the end date is not earlier than the start date.
5. Presence Check
A presence check verifies that a required field is not left empty. This is important for mandatory fields, like a user’s name or an email address, ensuring that no critical data is missing.
6. Format Check
Format checks ensure that data follows a specific format. For instance, an email address should have the format example@domain.com, while a date might need to be in the format DD/MM/YYYY.
7. Length Check
Length checks validate that the data entered meets a certain length requirement. For example, a password might need to be at least 8 characters long but no more than 16 characters.
Verification Methods
Verification ensures that data entered into a system is correct. It often involves checking the data entered against the original source.
1. Double Entry
Double entry involves entering the data twice and comparing both entries to ensure they match. This method is commonly used in password creation fields, where users are asked to enter their password twice to confirm it.
2. Proofreading
Proofreading involves manually checking the entered data for errors. This method is used to identify and correct typographical and transpositional errors. It is often employed in important documents where accuracy is critical, such as legal contracts.
Detailed Example Scenarios
Scenario 1: Online Shopping Form
Consider an online shopping form where users enter their shipping information:
Range Check: Validates the entered age is between 18 and 100.
Reasonableness Check: Ensures the entered address is a real address using a database of known addresses.
Data Type Check: Ensures the entered ZIP code is numerical.
Consistency Check: Verifies the state matches the city.
Presence Check: Ensures the email field is not empty.
Format Check: Validates the phone number follows a specific pattern.
Length Check: Ensures the credit card number is exactly 16 digits long.
Scenario 2: Employee Database
In an employee database system:
Double Entry: Used when entering employee IDs to ensure accuracy.
Proofreading: Used for proofreading payroll entries to ensure employees receive correct pay.
Importance of Validation and Verification
Validation and verification are critical in maintaining data integrity, preventing errors, and ensuring that systems operate smoothly and reliably. These methods help in reducing data entry errors, ensuring the correctness of the data, and maintaining the overall quality of the data.
Benefits of Validation
Error Reduction: Helps in minimizing the occurrence of errors during data entry.
Improved Data Quality: Ensures that the data entered into the system is accurate and meets the predefined criteria.
Efficiency: Reduces the time and effort needed for data correction later on.
Benefits of Verification
Accuracy: Ensures that the data is correct and matches the original source.
Reliability: Increases the reliability of the system by ensuring that the data is consistent and accurate.
Trustworthiness: Enhances the trustworthiness of the data and the system overall.
Conclusion
Understanding and implementing validation and verification methods are essential in Information Technology to maintain data accuracy and integrity. By using appropriate checks and processes, systems can ensure that data entered is both valid and verified, leading to more reliable and trustworthy outcomes.
File Organization and Access Methods
File organization refers to the way data is stored in files and accessed by systems. The appropriate file organization enhances the efficiency and performance of various applications. The main types of file access methods include sequential, serial, direct, and random. Each method has specific use cases and benefits.
File Access Methods
Sequential File Access
Sequential file access stores records in a specific order, usually based on a key field. This method reads and processes records in sequence, from the beginning to the end.
Advantages:
Simple implementation.
Efficient for tasks requiring complete file processing.
Disadvantages:
Inflexible for applications needing random access.
Slower for retrieving individual records.
Examples: Batch processing systems, data analysis tasks.
Serial File Access
Serial file access stores records in the order they are written without regard to any particular sequence. This method reads and processes records as they are stored.
Advantages:
Simple to maintain.
Ideal for append-only files.
Disadvantages:
Inefficient for searching specific records.
Not suitable for large databases.
Examples: Log files, transaction records.
Direct File Access
Direct file access allows records to be read or written directly without the need to traverse previous records. This method uses an indexing mechanism to locate records quickly.
Advantages:
Fast retrieval and updating of records.
Efficient for applications with frequent access to specific records.
Disadvantages:
More complex implementation.
Requires additional storage for indexes.
Examples: Database systems, real-time applications.
Random File Access
Random file access permits accessing records in any order. This method is similar to direct access but does not necessarily rely on an indexing mechanism.
Advantages:
Flexible for applications requiring frequent access to various records.
Efficient for non-sequential processing.
Disadvantages:
Complexity in ensuring data consistency.
Possible performance overhead.
Examples: Multimedia applications, interactive systems.
Application Areas
Different application areas benefit from specific file access methods. Here are the common application areas mentioned in the image:
Archiving
Archiving involves storing historical data for future reference or compliance purposes. Sequential and serial access methods are typically used.
Sequential Access: Ideal for archiving because it allows for efficient processing of large data sets.
Serial Access: Suitable for append-only files, such as transaction logs.
Payroll File
Payroll systems manage employee compensation and related data. Direct access is often preferred for this application.
Direct Access: Enables quick retrieval and updating of employee records, essential for timely payroll processing.
Sequential Access: Can be used for generating reports or processing payroll in batches.
Real-Time Systems
Real-time systems require immediate processing and response. Random and direct access methods are commonly used.
Random Access: Allows quick and flexible data retrieval, essential for real-time applications.
Direct Access: Facilitates fast updates and access to specific records, crucial for real-time processing.
Summary and Best Practices
When selecting a file organization method, consider the following factors:
Data Access Patterns: Understand how the data will be accessed and processed.
Performance Requirements: Evaluate the need for speed and efficiency.
Data Volume: Consider the size and growth of the data.
Maintenance: Assess the complexity of implementation and ongoing maintenance.
In summary, file organization plays a crucial role in optimizing the performance and efficiency of various applications. By selecting the appropriate file access method, organizations can ensure effective data management and processing.
Section Two: COMPUTER NETWORKS AND WEB TECHNOLOGIES
Types of Networks
1. Local Area Network (LAN)
A Local Area Network (LAN) is a network that interconnects computers within a limited area such as a residence, school, laboratory, or office building. LANs are characterized by higher data-transfer rates, smaller geographic range, and lack of a need for leased telecommunication lines.
Key points about LAN:
Geographic Range: Usually confined to a single building or a group of buildings.
Data Transfer Rates: Typically range from 100 Mbps to 10 Gbps.
Network Topologies: Common topologies include star, ring, bus, and mesh.
Usage: Common in schools, offices, and homes for sharing resources such as printers, files, and internet access.
2. Metropolitan Area Network (MAN)
A Metropolitan Area Network (MAN) covers a larger geographic area than a LAN but is smaller than a Wide Area Network (WAN). It typically spans a city or a large campus and can be used to connect multiple LANs within a city or campus.
Key points about MAN:
Geographic Range: Spans a city or a large campus.
Data Transfer Rates: Typically range from 100 Mbps to 1 Gbps.
Usage: Used by universities, government agencies, and large organizations to connect their buildings within a city or campus.
3. Wide Area Network (WAN)
A Wide Area Network (WAN) covers a broad area (i.e., any network whose communications links cross metropolitan, regional, or national boundaries). It is used to connect different smaller networks, including LANs and MANs, so that computers and users in one location can communicate with computers and users in other locations.
Key points about WAN:
Geographic Range: Covers broad areas such as regions, countries, or even continents.
Data Transfer Rates: Typically range from 50 Mbps to 100 Gbps.
Usage: Commonly used by businesses and government agencies to connect various branch offices and remote sites.
4. Mobile Network
A mobile network is a communication network spread over large areas and connected via wireless communication systems. Mobile networks primarily refer to cellular networks, which are radio-based common carriers.
Key points about mobile networks:
Concept: Radio-based common carriers that provide wireless connectivity to mobile devices.
Evolution: Has evolved from 2G (second generation) networks to current generations such as 5G.
Usage: Provides connectivity for mobile phones, tablets, and other mobile devices, allowing for voice, data, and messaging services.
Overview of Mobile Networks: From 2G to Current
1. 2G Networks
Second Generation (2G) networks were the first to introduce digital voice communication and basic data services like SMS and MMS.
Key points about 2G:
Technology: Based on GSM (Global System for Mobile Communications) and CDMA (Code Division Multiple Access).
Features: Digital voice, SMS, and basic internet access.
Era: Introduced in the early 1990s.
2. 3G Networks
Third Generation (3G) networks provided improved data speeds and the ability to handle multimedia applications such as video calls and mobile internet access.
Key points about 3G:
Technology: Based on UMTS (Universal Mobile Telecommunications System) and EV-DO (Evolution-Data Optimized).
Features: Enhanced mobile internet access, video calling, and better voice quality.
Era: Introduced in the early 2000s.
3. 4G Networks
Fourth Generation (4G) networks provided even faster data speeds and enhanced multimedia capabilities, enabling high-definition streaming and video conferencing.
Key points about 4G:
Technology: Based on LTE (Long Term Evolution) and WiMAX (Worldwide Interoperability for Microwave Access).
Features: High-speed internet access, HD video streaming, and improved voice and data quality.
Era: Introduced in the late 2000s.
4. 5G Networks
Fifth Generation (5G) networks are the latest in mobile network technology, offering significantly higher data speeds, lower latency, and the capacity to connect a large number of devices simultaneously.
Key points about 5G:
Technology: Based on NR (New Radio) standards developed by the 3GPP (3rd Generation Partnership Project).
Features: Ultra-fast internet speeds, low latency, support for IoT (Internet of Things) devices, and enhanced mobile broadband.
Era: Introduced in the late 2010s and early 2020s.
Wireless Network Technologies
1. Bluetooth
Bluetooth is a wireless technology standard for exchanging data over short distances using short-wavelength UHF (ultra-high-frequency) radio waves.
Key points about Bluetooth:
Range: Typically up to 100 meters.
Applications: Used for connecting peripherals like headphones, keyboards, mice, and for data transfer between devices.
Features: Low power consumption, easy pairing process, and secure connections.
2. Wi-Fi
Wi-Fi (Wireless Fidelity) is a technology that allows devices to connect to a network wirelessly using radio waves.
Key points about Wi-Fi:
Range: Typically up to 100 meters indoors and 300 meters outdoors.
Applications: Used for internet access, file sharing, and media streaming in homes, offices, and public places.
Features: High data transfer rates, multiple device connectivity, and secure encryption protocols (e.g., WPA2).
3. Hotspot
A hotspot is a physical location where people can access the internet using Wi-Fi via a wireless local area network (WLAN) with a router connected to an internet service provider.
Key points about hotspots:
Range: Typically similar to Wi-Fi, up to 100 meters.
Applications: Common in cafes, airports, hotels, and public spaces to provide internet access to visitors.
Features: Easy access to the internet, secure connections, and often password-protected.
Levels of Privacy
1. Intranet
An intranet is a private network accessible only to an organization’s staff. Often used to store company policies, procedures, and internal communications.
Key points about intranet:
Access: Restricted to authorized personnel within an organization.
Features: Secure communication, centralized information sharing, and internal applications.
Usage: Used for internal collaboration, document management, and information dissemination.
2. Extranet
An extranet is a controlled private network that allows access to partners, vendors, and other authorized users outside the organization.
Key points about extranet:
Access: Restricted to authorized external users in addition to internal staff.
Features: Secure external communication, collaboration with partners, and access to specific resources.
Usage: Used for B2B (Business-to-Business) communication, supply chain management, and partner collaboration.
3. Internet
The internet is a global network that connects millions of private, public, academic, business, and government networks.
Key points about the internet:
Access: Open and accessible to anyone with a connection.
Features: Vast amount of information, various communication platforms, and numerous online services.
Usage: Used for information retrieval, communication, entertainment, and e-commerce.
Introduction to Networking: Components and Functions
Basic Components and Functions of a Network
1. Transmission Media
Transmission media are the physical pathways that connect computers, other devices, and people on a network.
They can be categorized into wired and wireless media.
(a) Wired Media:
Wired media use cables to connect network devices. The three main types of wired media are:
Twisted Pair:
Description: Twisted pair cables consist of pairs of insulated copper wires twisted together. They are commonly used in telecommunication and network cabling.
Types:
Unshielded Twisted Pair (UTP): Lacks additional shielding, used for Ethernet cabling (Category 5, 5e, 6, etc.).
Shielded Twisted Pair (STP): Includes additional shielding to reduce electromagnetic interference.
Function: Transmits data via electrical signals. Suitable for short to medium distances and provides decent data transfer rates.
Coaxial Cable:
Description: Consists of a central conductor, an insulating layer, a metallic shield, and an outer insulating layer. Commonly used for cable television and internet.
Function: Transmits data using electrical signals. Offers higher bandwidth and better noise immunity compared to twisted pair cables. Suitable for medium distances.
Fibre Optic Cable:
Description: Uses light to transmit data. Composed of a core (glass or plastic), cladding, and protective outer layers.
Types:
Single-mode Fiber: Designed for long-distance communication using laser light.
Multi-mode Fiber: Suitable for shorter distances using LED light.
Function: Transmits data at very high speeds over long distances. Immune to electromagnetic interference and provides high bandwidth.
(b) Wireless Media:
Wireless media transmit data through the air using electromagnetic waves. The main types include:
Infrared:
Description: Uses infrared light to transmit data over short distances. Requires a direct line of sight between devices.
Function: Commonly used for remote controls, short-range communication between devices like smartphones and laptops.
Microwave:
Description: Uses high-frequency radio waves to transmit data. Can be terrestrial (ground-based) or satellite-based.
Function: Suitable for long-distance communication. Used in point-to-point communication links, satellite communication, and cellular networks.
Satellite:
Description: Uses satellites to transmit data. Provides coverage over large areas, including remote regions.
Function: Used for television broadcasting, internet access in remote areas, and global positioning systems (GPS). Transmits data over very long distances.
2. Network Devices
Network devices are essential for connecting and managing network communication. The key devices include:
Switch:
Description: A networking device that connects multiple devices within a local area network (LAN).
Function: Receives data packets and forwards them to the appropriate destination device within the same network. Operates at the data link layer (Layer 2) of the OSI model. Ensures efficient data transfer and reduces network congestion by segmenting traffic.
Router:
Description: A networking device that connects multiple networks and routes data packets between them.
Function: Determines the best path for data packets to reach their destination across different networks. Operates at the network layer (Layer 3) of the OSI model. Used for internet connectivity, routing traffic between LANs, and managing IP addresses.
Modem:
Description: A device that modulates and demodulates digital data for transmission over analog communication channels.
Function: Converts digital data from a computer into analog signals for transmission over telephone lines, cable systems, or satellite links (modulation). Converts incoming analog signals back into digital data for the computer (demodulation). Used for internet access, especially in DSL and cable internet connections.
Network Interface Card (NIC) / Network Adapter:
Description: A hardware component that provides network connectivity for a computer or device.
Function: Allows a device to connect to a network, either wired (Ethernet NIC) or wireless (Wi-Fi NIC). Provides a unique physical address (MAC address) for the device on the network. Facilitates communication by sending and receiving data packets.
3. Network Topologies
Network topology refers to the layout or structure of a network, determining how devices are interconnected. The main types include:
Bus Topology:
Description: All devices are connected to a single central cable, known as the bus.
Function: Simple and cost-effective for small networks. However, it has limitations in terms of scalability and fault tolerance.
Star Topology:
Description: All devices are connected to a central hub or switch.
Function: Provides better performance and fault tolerance compared to bus topology. If one link fails, the rest of the network remains operational.
Ring Topology:
Description: Devices are connected in a circular loop.
Function: Data travels in one direction (or both directions in a dual-ring setup). Each device acts as a repeater, ensuring data integrity. However, a break in the ring can disrupt the entire network.
Mesh Topology:
Description: Every device is connected to every other device in the network.
Function: Provides high redundancy and fault tolerance. If one link fails, data can be rerouted through other paths. However, it is complex and expensive to implement.
Hybrid Topology:
Description: Combines two or more different topologies.
Function: Takes advantage of the benefits of each individual topology. Used in large networks to improve performance, scalability, and fault tolerance.
4. Network Protocols
Network protocols are the rules and standards that govern communication between devices on a network.
Key protocols include:
Transmission Control Protocol/Internet Protocol (TCP/IP):
Description: A suite of communication protocols used for the internet and similar networks.
Function: TCP ensures reliable data transmission by establishing a connection and ensuring data packets are received in order. IP handles addressing and routing, determining the best path for data packets to reach their destination.
Hypertext Transfer Protocol (HTTP) and HTTPS:
Description: Protocols used for transferring web pages and data over the internet.
Function: HTTP is used for unsecured data transfer, while HTTPS provides secure data transfer by encrypting the data using SSL/TLS.
File Transfer Protocol (FTP):
Description: A protocol used for transferring files between computers on a network.
Function: Allows users to upload and download files to and from a remote server. Supports authentication and can transfer large files efficiently.
Simple Mail Transfer Protocol (SMTP):
Description: A protocol used for sending email.
Function: Transfers email messages from a client to a mail server and between mail servers. Works with other protocols like IMAP and POP for retrieving email.
Domain Name System (DNS):
Description: A system that translates domain names into IP addresses.
Function: Allows users to access websites using human-readable domain names (e.g., www.globelearners.com) instead of numerical IP addresses.
5. Network Security
Network security involves measures to protect data and resources from unauthorized access, attacks, and breaches.
Key concepts include:
Firewall:
Description: A network security device or software that monitors and controls incoming and outgoing network traffic.
Function: Enforces security policies by allowing or blocking traffic based on predefined rules. Protects the network from unauthorized access and cyberattacks.
Encryption:
Description: The process of converting data into a coded form to prevent unauthorized access.
Function: Ensures data confidentiality and integrity during transmission. Common encryption methods include SSL/TLS for secure web communication and AES for secure data storage.
Virtual Private Network (VPN):
Description: A technology that creates a secure, encrypted connection over a public network (such as the internet).
Function: Allows remote users to securely access a private network. Protects data from interception and eavesdropping.
Antivirus Software:
Description: A program designed to detect, prevent, and remove malware (e.g., viruses, worms, Trojans).
Function: Scans files and programs for known malware signatures. Provides real-time protection against threats and regularly updates its database to recognize new malware.
Conclusion
Understanding the basic components and functions of a network is essential for anyone studying Information Technology. These components form the backbone of network infrastructure, enabling communication and data exchange between devices. By comprehensively covering these topics, students can build a strong foundation in networking principles and practices.
The Importance of Mobile Communication Technologies
Introduction to Mobile Communication Technologies
Mobile communication technologies have become an indispensable part of our daily lives. From basic cellular phones to sophisticated smartphones, these technologies have revolutionized the way we communicate, work, and entertain ourselves. The development of mobile communication technologies can be traced back to the early 20th century, but it wasn’t until the late 20th and early 21st centuries that they became widely accessible and integrated into society.
Evolution of Mobile Communication Technologies
The journey of mobile communication technologies began with the first-generation (1G) analog cellular systems in the 1980s. These systems provided basic voice communication services but were limited in terms of coverage and capacity. The advent of second-generation (2G) digital systems in the 1990s introduced significant improvements, including better voice quality, increased capacity, and the ability to send text messages (SMS).
The third-generation (3G) systems, introduced in the early 2000s, marked a significant milestone by providing enhanced data services, enabling users to access the internet, send emails, and use multimedia applications on their mobile devices. The fourth-generation (4G) systems, launched in the late 2000s, further revolutionized mobile communication by offering high-speed internet access, enabling seamless streaming of high-definition videos and faster data transfer rates.
Currently, the fifth-generation (5G) systems are being deployed worldwide, promising even faster speeds, lower latency, and the ability to connect a vast number of devices simultaneously. 5G is expected to drive innovations in various fields, including the Internet of Things (IoT), autonomous vehicles, and smart cities.
Role in Modern Communication Networks
Mobile communication technologies play a crucial role in modern communication networks. They provide the infrastructure for voice and data services, enabling people to stay connected regardless of their location. Mobile networks have become the backbone of the digital economy, supporting a wide range of applications, from social media and e-commerce to telemedicine and remote work.
Benefits of Mobile Communication Technologies
The benefits of mobile communication technologies are manifold:
Accessibility: Mobile phones provide communication access to remote and underserved areas, bridging the digital divide and promoting social inclusion.
Convenience: Mobile devices are portable and easy to use, allowing people to communicate on the go and access information anytime, anywhere.
Economic Growth: The mobile industry contributes significantly to the global economy by creating jobs, fostering innovation, and enabling new business models.
Emergency Response: Mobile networks play a vital role in emergency response and disaster management by providing real-time communication and coordination.
Challenges and Future Prospects
Despite their numerous benefits, mobile communication technologies face several challenges, including spectrum scarcity, network congestion, and cybersecurity threats. Addressing these challenges requires continuous innovation and investment in infrastructure, as well as collaboration between governments, industry stakeholders, and academia.
The future of mobile communication technologies looks promising, with the ongoing deployment of 5G and the development of 6G technologies. These advancements are expected to further enhance connectivity, support emerging technologies, and drive socio-economic development.
Suitability of Mobile Networks for Various Applications
Mobile Networks in Education
Mobile networks have transformed the education sector by providing new opportunities for learning and collaboration. Here are some ways mobile networks are being utilized in education:
E-Learning Platforms: Mobile networks enable access to e-learning platforms, allowing students to take courses, access study materials, and participate in discussions from their mobile devices.
Interactive Learning: Mobile applications offer interactive learning experiences through multimedia content, quizzes, and simulations, making learning more engaging and effective.
Remote Education: Mobile networks support remote education by enabling live video lectures, virtual classrooms, and online assessments, ensuring continuity of education during disruptions such as pandemics.
Mobile Networks in Commerce
The impact of mobile networks on commerce has been profound, transforming the way businesses operate and consumers shop. Key applications of mobile networks in commerce include:
Mobile Payments: Mobile networks facilitate secure and convenient mobile payment solutions, enabling users to make transactions using their mobile devices.
E-Commerce: Mobile networks support e-commerce platforms, allowing businesses to reach a wider audience and consumers to shop online from anywhere.
Marketing and Advertising: Mobile networks enable targeted marketing and advertising through location-based services, SMS marketing, and mobile apps, helping businesses reach their target audience effectively.
Mobile Networks in Journalism
Mobile networks have revolutionized journalism by enabling real-time reporting, citizen journalism, and new forms of storytelling. Here are some ways mobile networks are being used in journalism:
Live Reporting: Mobile networks allow journalists to report live from the field using their mobile devices, providing real-time updates and breaking news coverage.
Citizen Journalism: Mobile networks empower ordinary citizens to capture and share news events using their smartphones, contributing to the democratization of news production.
Multimedia Content: Mobile networks support the creation and distribution of multimedia content, including videos, photos, and interactive stories, enhancing the way news is presented and consumed.
Challenges and Opportunities
While mobile networks offer numerous opportunities for education, commerce, and journalism, they also present challenges, such as data privacy, digital divide, and the need for regulatory frameworks. Addressing these challenges requires a multi-stakeholder approach, involving policymakers, industry players, and civil society.
Fundamentals of the World Wide Web
1. World Wide Web (WWW)
The World Wide Web, commonly referred to as the Web, is an information system where documents and other web resources are identified by Uniform Resource Locators (URLs). These resources are accessible via the Internet, making the WWW a crucial platform for sharing and accessing information globally.
Interrelationship:
The World Wide Web is the foundation that supports various web technologies and services. It relies on protocols like HTTP and uses web browsers to display web pages created with HTML. The WWW is also interconnected with servers that host these pages and enable file transfers.
2. Hypertext Markup Language (HTML)
HTML is the standard language used to create and structure content on the web. It consists of a series of elements that describe different parts of a webpage, such as headings, paragraphs, links, and images.
Interrelationship:
HTML is essential for creating web pages that are displayed on the World Wide Web. It works in conjunction with other technologies like CSS for styling and JavaScript for interactivity. HTML documents are interpreted by web browsers to render content for users.
3. Hypertext Transfer Protocol (HTTP)
HTTP is the protocol used for transmitting hypertext requests and information on the Internet. It is the foundation of any data exchange on the Web and defines how messages are formatted and transmitted.
Interrelationship:
HTTP is used to request and deliver HTML documents from web servers to browsers. It enables the communication between the client (web browser) and server, making the web functional and interactive.
4. Hyperlinks
Hyperlinks, or links, are references in HTML documents that users can click on to navigate from one webpage to another. They are defined using the <a>
tag in HTML.
Interrelationship:
Hyperlinks are the backbone of the WWW, enabling users to connect different web resources seamlessly. They make navigation intuitive and link various pieces of information across the web.
5. Web Server
A web server is a software or hardware that stores and serves web content to users. It processes incoming network requests over HTTP and several other related protocols.
Interrelationship:
Web servers host HTML documents and other web resources, responding to requests made by web browsers. They are essential for delivering web pages and managing web traffic.
6. Web Page
A web page is a document available on the WWW, typically written in HTML and accessed through a web browser. Web pages can contain text, images, videos, and other multimedia elements.
Interrelationship:
Web pages are the primary content displayed by web browsers, hosted on web servers, and accessed via URLs. They form the fundamental building blocks of the Web.
7. File Transfer Protocol (FTP)
FTP is a standard network protocol used for transferring files between a client and server over the Internet. It is used to upload and download files from web servers.
Interrelationship:
FTP is critical for managing web content, allowing users to upload new web pages and resources to web servers. It complements HTTP by providing a method for transferring large files and directories.
8. Web Browser
A web browser is software that allows users to access, retrieve, and view web content on the World Wide Web. Popular web browsers include Chrome, Firefox, Safari, and Edge.
Interrelationship:
Web browsers interpret HTML documents and render web pages for users. They use HTTP to communicate with web servers and enable interaction with web resources.
9. Uniform Resource Locator (URL)
A URL is the address of a resource on the Internet. It specifies the location of a web page or file on the web and how to retrieve it.
Interrelationship:
URLs are used to access web resources hosted on web servers. They are an essential part of the WWW, enabling users to navigate to specific web pages.
10. Upload and Download
Uploading is the process of transferring data from a local system to a web server, while downloading is the process of transferring data from a web server to a local system.
Interrelationship:
Uploading and downloading are fundamental operations on the web, enabling the distribution and retrieval of content. They are often facilitated by protocols like FTP and HTTP.
11. Email
Email is a method of exchanging digital messages over the Internet. It uses protocols such as SMTP, IMAP, and POP3 to send, receive, and manage messages.
Interrelationship:
Email services are an integral part of the web ecosystem, often accessed through web browsers or email clients. They rely on various web technologies to function seamlessly.
Section Three: SOCIAL AND ECONOMIC IMPACT OF INFORMATION AND COMMUNICATIONS TECHNOLOGY (ICT)
IMPLICATIONS OF MISUSE AND CYBERSECURITY
Computer Security and Cybersecurity: Assessment and Minimization of Risk
Computer Security and Cybersecurity are intertwined fields focused on protecting computer systems, networks, and data from unauthorized access, attack, or damage. While both terms are often used interchangeably, they have nuanced differences. Computer security is a broader term that covers the protection of all computing systems and their components, including both hardware and software. Cybersecurity, on the other hand, specifically deals with protecting internet-connected systems, including hardware, software, and data, from cyber threats.
Key Elements:
Vulnerability
Threat
Attack
Countermeasure
Vulnerability
A vulnerability is a weakness in a system that can be exploited by a threat actor, such as an attacker, to perform unauthorized actions within a computer system. Vulnerabilities can exist in various forms, such as:
Software vulnerabilities: Bugs or flaws in software code.
Hardware vulnerabilities: Physical defects or bugs in hardware components.
Network vulnerabilities: Weaknesses in network security protocols or configurations.
Human vulnerabilities: Human errors or insider threats.
Threat
A threat is any potential cause of an unwanted incident that may result in harm to a system or organization. Threats can be categorized as:
Natural threats: Events such as floods, earthquakes, or hurricanes.
Human-made threats: Deliberate actions by individuals or groups, such as hacking, phishing, or malware.
Environmental threats: Issues arising from the environment where the system operates, such as power failures or industrial accidents.
Attack
An attack is an intentional act to exploit a vulnerability. Attacks can be carried out by individuals or groups and can take various forms, including:
Malware attacks: Using malicious software like viruses, worms, or ransomware.
Phishing attacks: Deceptive attempts to steal sensitive information by masquerading as a trustworthy entity.
Denial-of-Service (DoS) attacks: Flooding a network or server with traffic to make it unavailable to users.
Man-in-the-Middle (MitM) attacks: Intercepting and altering communication between two parties without their knowledge.
Countermeasure
A countermeasure is an action, device, or process that reduces or eliminates a vulnerability, mitigating potential threats and attacks. Countermeasures can include:
Technical controls: Firewalls, intrusion detection systems (IDS), and encryption.
Administrative controls: Security policies, procedures, and awareness training.
Physical controls: Access control systems, security guards, and surveillance cameras.
Computer Misuse by Individuals and Groups/Organizations
Computer misuse refers to the unauthorized use, access, modification, or destruction of computer systems, networks, and data. This misuse can be perpetrated by individuals or groups and can lead to significant financial and reputational damage. Common forms of computer misuse include:
Hacking: Unauthorized access to computer systems or networks with malicious intent.
Phishing: Deceptive attempts to obtain sensitive information by pretending to be a trustworthy entity.
Malware distribution: Creating and spreading malicious software to compromise systems and data.
Data theft: Unauthorized access and extraction of sensitive information.
Cyberstalking: Using the internet to harass or intimidate individuals.
Implications of Misuse and Cybersecurity
Financial Implications
The financial implications of cybersecurity breaches and computer misuse can be devastating for individuals, businesses, and governments. Costs can include:
Direct financial losses: Theft of funds through cybercrime.
Operational disruptions: Costs associated with business downtime and recovery efforts.
Legal liabilities: Fines and legal fees resulting from data breaches or regulatory non-compliance.
Reputational damage: Loss of customer trust and potential loss of business.
Social and Psychological Implications
Cybersecurity breaches and computer misuse can also have significant social and psychological impacts on individuals and communities:
Identity theft: Victims may suffer long-term consequences, including financial loss and emotional distress.
Privacy invasion: Unauthorized access to personal data can lead to embarrassment, blackmail, or harassment.
Loss of trust: Widespread incidents of cybercrime can erode public confidence in digital systems and institutions.
National Security Implications
Cybersecurity is a critical component of national security. Cyber attacks on critical infrastructure, such as power grids, transportation systems, and financial institutions, can have far-reaching consequences:
Disruption of essential services: Attacks on infrastructure can cause widespread chaos and endanger public safety.
Economic destabilization: Large-scale cyber attacks can disrupt financial markets and economic stability.
Espionage and intelligence gathering: Nation-states may engage in cyber espionage to gather sensitive information for strategic advantage.
Conclusion
Understanding the key elements of vulnerability, threat, attack, and countermeasure is crucial in the field of computer security and cybersecurity. Addressing computer misuse requires a multi-faceted approach that includes technical, administrative, and physical controls. As technology continues to evolve, the importance of robust cybersecurity measures and awareness cannot be overstated.
Additional Topics in Cybersecurity
Cryptography
Cryptography is the practice of securing communication and information through the use of codes and encryption. It involves the conversion of data into a format that is unreadable to unauthorized users. Key concepts in cryptography include:
Encryption: The process of converting plaintext data into ciphertext using an algorithm and key.
Decryption: The process of converting ciphertext back into plaintext using the appropriate key.
Digital signatures: Electronic signatures that verify the authenticity and integrity of a message or document.
Public Key Infrastructure (PKI): A framework for managing digital keys and certificates.
Network Security
Network security involves protecting the integrity, confidentiality, and availability of data as it travels across networks. Key components of network security include:
Firewalls: Devices or software that monitor and control incoming and outgoing network traffic based on security rules.
Intrusion Detection Systems (IDS): Systems that monitor network traffic for suspicious activity and potential threats.
Virtual Private Networks (VPNs): Secure connections between remote users and a private network.
Wireless security: Measures to protect wireless networks from unauthorized access and attacks.
Application Security
Application security focuses on protecting software applications from vulnerabilities and attacks. Key aspects of application security include:
Secure coding practices: Writing code that is resistant to common vulnerabilities, such as buffer overflows and SQL injection.
Application testing: Identifying and fixing security flaws through techniques such as penetration testing and static analysis.
Access controls: Implementing authentication and authorization mechanisms to ensure only authorized users can access the application.
Emerging Trends in Cybersecurity
Artificial Intelligence and Machine Learning
Artificial intelligence (AI) and machine learning (ML) are increasingly being used to enhance cybersecurity. These technologies can help:
Detect anomalies: AI and ML can identify unusual patterns of behavior that may indicate a cyber attack.
Automate response: AI-powered systems can automatically respond to threats in real-time, reducing the need for human intervention.
Predict threats: ML algorithms can analyze historical data to predict future cyber threats and vulnerabilities.
Internet of Things (IoT) Security
The proliferation of IoT devices presents new cybersecurity challenges. IoT security involves protecting interconnected devices from vulnerabilities and attacks. Key considerations for IoT security include:
Device authentication: Ensuring that only authorized devices can connect to the network.
Data encryption: Protecting data transmitted between IoT devices and central systems.
Firmware updates: Regularly updating device firmware to fix security vulnerabilities.
Quantum Computing
Quantum computing has the potential to revolutionize cybersecurity, both positively and negatively. While quantum computers could break traditional encryption methods, they could also enable new forms of secure communication. Key concepts in quantum computing and cybersecurity include:
Quantum encryption: Using the principles of quantum mechanics to create unbreakable encryption.
Post-quantum cryptography: Developing encryption algorithms that are resistant to quantum attacks.
Ethical and Legal Considerations
Ethical Hacking
Ethical hacking, also known as penetration testing or white-hat hacking, involves authorized attempts to find and fix security vulnerabilities. Ethical hackers play a crucial role in improving cybersecurity by:
Identifying weaknesses: Finding and reporting vulnerabilities before malicious hackers can exploit them.
Testing defenses: Assessing the effectiveness of security measures through simulated attacks.
Raising awareness: Educating organizations and individuals about potential security risks.
Data Protection Regulations
Governments around the world have implemented regulations to protect personal data and ensure cybersecurity. Key regulations include:
General Data Protection Regulation (GDPR): A comprehensive data protection law in the European Union that sets strict guidelines for data collection, processing, and storage.
Health Insurance Portability and Accountability Act (HIPAA): U.S. regulations that protect the privacy and security of health information.
California Consumer Privacy Act (CCPA): A data privacy law in California that grants consumers rights over their personal information.
Conclusion
The concepts of computer security, cybersecurity, and computer misuse are vast and multifaceted. Understanding the key elements of vulnerability, threat, attack, and countermeasure is essential for protecting computer systems and data. As technology continues to evolve, the importance of robust cybersecurity measures and awareness cannot be overstated. By staying informed and proactive, individuals and organizations can mitigate the risks and challenges associated with cybersecurity.
References
Schneier, B. (2015). Data and Goliath: The Hidden Battles to Collect Your Data and Control Your World. W.W. Norton & Company.
Whitman, M. E., & Mattord, H. J. (2017). Principles
Potential Impacts of Cyber Systems Misuse
1. Cyberbullying
Definition: Cyberbullying refers to the use of digital platforms to harass, threaten, or demean individuals.
Impacts:
Individual: Psychological distress, anxiety, depression, and sometimes physical harm.
Organization: Employee productivity loss, reputation damage if bullying occurs within the organization.
Government: Need for policy and legislation to address and mitigate bullying. Potential strain on mental health services.
2. Copyright Infringement
Definition: Unauthorized use or reproduction of another’s work without permission.
Impacts:
Individual: Legal consequences, loss of income for creators.
Organization: Financial loss, legal battles, loss of credibility.
Government: Enforcement costs, international trade tensions.
3. Data Theft
Definition: Unauthorized access and extraction of sensitive information.
Impacts:
Individual: Loss of privacy, identity theft, financial loss.
Organization: Financial damage, loss of customer trust, competitive disadvantage.
Government: National security risks, economic implications, need for stronger cybersecurity measures.
4. Denial of Service (DoS) Attacks
Definition: Disrupting access to a network or service by overwhelming it with traffic.
Impacts:
Individual: Inability to access services, financial loss if the service is critical.
Organization: Downtime, financial loss, reputation damage.
Government: Threat to critical infrastructure, national security concerns.
5. Transmission of Viruses and Malware
Definition: Spreading malicious software that disrupts, damages, or gains unauthorized access to systems.
Impacts:
Individual: Data loss, financial theft, privacy invasion.
Organization: System downtime, financial loss, reputation damage, recovery costs.
Government: National security threats, financial costs in public sector systems, need for response strategies.
6. Identity Theft
Definition: Stealing personal information to impersonate someone.
Impacts:
Individual: Financial loss, legal complications, emotional distress.
Organization: Employee identity theft can lead to data breaches, financial and reputational damage.
Government: Need for extensive measures to protect citizens, costs associated with identity restoration.
7. Online Publication of Obscene Materials
Definition: Distributing obscene, offensive, or illegal content on digital platforms.
Impacts:
Individual: Psychological harm, exposure to inappropriate content.
Organization: Legal repercussions, damage to brand image, potential financial penalties.
Government: Regulatory challenges, enforcement costs, societal impact.
8. Phishing Attacks
Definition: Fraudulent attempts to obtain sensitive information by pretending to be a trustworthy entity.
Impacts:
Individual: Financial loss, identity theft, privacy invasion.
Organization: Data breaches, financial loss, damage to customer trust.
Government: Public sector breaches, national security concerns, need for public awareness campaigns.
9. Software and Music Piracy
Definition: Unauthorized copying and distribution of software or music.
Impacts:
Individual: Legal consequences, potential exposure to malware.
Organization: Financial loss, intellectual property theft, legal issues.
Government: Loss of revenue, need for enforcement, international trade issues.
10. Financial Abuses
Definition: Fraudulent financial activities using digital means.
Impacts:
Individual: Financial loss, emotional distress, credit damage.
Organization: Financial loss, reputational damage, legal consequences.
Government: Economic impact, increased need for regulation, and enforcement resources.
11. Violation of Privacy
Definition: Unauthorized access and exposure of personal information.
Impacts:
Individual: Emotional distress, security risks, loss of trust.
Organization: Legal penalties, reputational damage, loss of customer trust.
Government: Need for stringent data protection laws, impact on public trust.
12. Propaganda
Definition: Spreading misleading or biased information to manipulate public opinion.
Impacts:
Individual: Misinformation, influence on beliefs and decisions.
Organization: Impact on public relations, employee morale.
Government: Societal instability, need for countermeasures, impact on democratic processes.
13. Electronic Eavesdropping
Definition: Secretly listening to private communications without consent.
Impacts:
Individual: Privacy invasion, security risks.
Organization: Loss of confidential information, legal consequences.
Government: National security threats, diplomatic issues.
14. Industrial Espionage
Definition: Spying on competitors to gain business advantage.
Impacts:
Individual: Job insecurity, privacy invasion.
Organization: Loss of intellectual property, competitive disadvantage.
Government: Impact on economic stability, need for regulation.
Implications of Cybersecurity and Countermeasures
I. Introduction
Cybersecurity is the practice of protecting systems, networks, and programs from digital attacks. These attacks are usually aimed at accessing, changing, or destroying sensitive information, extorting money from users, or interrupting normal business processes. Implementing effective cybersecurity measures is particularly challenging today because there are more devices than people, and attackers are becoming more innovative.
II. Physical Measures
Physical security measures are fundamental to protecting hardware, software, and data from physical actions and events that could cause serious loss or damage. These events can include natural disasters, fire, theft, and vandalism.
1. Backup and Recovery Procedures
a. Regular Backups: Ensure that all critical data is backed up regularly. Use both on-site and off-site storage solutions.
b. Recovery Plans: Develop comprehensive recovery plans to ensure data can be restored quickly and efficiently in case of data loss or corruption.
c. Testing Backups: Regularly test the backups to ensure that they can be restored successfully.
2. Hardware Firewalls
a. Network Segmentation: Use hardware firewalls to segment networks and control traffic between different network segments, limiting the spread of malware.
b. Intrusion Detection: Firewalls should include intrusion detection systems (IDS) to monitor for and alert administrators about potential threats.
c. Regular Updates: Keep firewall firmware updated to protect against new vulnerabilities.
3. Intrusion Detection Systems (IDS)
a. Network-Based IDS: These systems monitor network traffic for suspicious activity and known threats.
b. Host-Based IDS: These systems monitor individual devices for suspicious activity, such as unauthorized file modifications.
c. Response Plans: Develop and implement response plans for when IDS alerts are triggered.
4. Biometrics
a. Access Control: Use biometric systems for secure access control to critical areas and systems.
b. Types of Biometrics: Common biometric systems include fingerprint scanners, facial recognition, iris scanning, and voice recognition.
c. Privacy Considerations: Ensure that biometric data is stored securely and that users’ privacy is protected.
III. Software Measures
Software measures involve the use of technology and tools to protect data and systems from unauthorized access, attacks, and malware.
1. Effective Passwords and Authentication Systems
a. Strong Passwords: Implement policies that require users to create strong, complex passwords.
b. Multi-Factor Authentication (MFA): Use MFA to add an extra layer of security beyond just passwords.
c. Password Managers: Encourage the use of password managers to help users manage complex passwords securely.
2. Encryption of Data
a. Data Encryption: Encrypt sensitive data both at rest and in transit to protect it from unauthorized access.
b. Encryption Standards: Use strong encryption standards, such as AES-256, to ensure data is adequately protected.
c. Key Management: Implement robust key management practices to protect encryption keys.
3. Firewalls
a. Software Firewalls: Use software firewalls on individual devices to protect them from unauthorized access and threats.
b. Configuration: Properly configure firewalls to block unauthorized traffic and allow legitimate traffic.
c. Monitoring: Regularly monitor firewall logs for signs of suspicious activity.
4. Biometrics
a. Integration: Integrate biometric systems with software applications for secure authentication.
b. User-Friendly: Ensure that biometric systems are user-friendly and do not create barriers to legitimate access.
c. Regular Updates: Keep biometric software updated to protect against vulnerabilities and improve accuracy.
5. Antivirus and Malware Detection
a. Regular Scans: Perform regular scans to detect and remove malware from systems.
b. Real-Time Protection: Use antivirus software with real-time protection to detect and block malware as it appears.
c. Updates: Keep antivirus software updated to protect against the latest threats.
IV. Personal Security Practices
Personal security practices are actions that individuals can take to protect themselves and their information from cyber threats.
1. Verifying Authenticity of Emails and Websites
a. Email Verification: Always verify the authenticity of emails before responding or clicking on links. Check the sender’s email address and look for signs of phishing.
b. Website Verification: Assess website URLs for authenticity. Ensure that websites are secure (look for HTTPS) and avoid entering sensitive information on suspicious websites.
2. Limiting Access to Open Wi-Fi Networks
a. Secure Wi-Fi: Use secure, password-protected Wi-Fi networks whenever possible. Avoid using open Wi-Fi networks for sensitive transactions.
b. VPNs: Use Virtual Private Networks (VPNs) to encrypt internet traffic and protect data when using public Wi-Fi.
3. Securing Mobile Devices
a. Password Protection: Use strong passwords or biometric authentication to lock mobile devices.
b. Updates: Keep mobile operating systems and apps updated to protect against vulnerabilities.
c. Mobile Security Software: Install and use mobile security software to protect against malware and other threats.
4. Protection in Online Environments (e.g., Social Media)
a. Privacy Settings: Adjust privacy settings on social media accounts to control who can see your information.
b. Personal Information: Be cautious about sharing personal information online. Avoid posting sensitive details that could be used for identity theft.
c. Awareness: Stay informed about the latest social media scams and security threats.
Conclusion
In the realm of cybersecurity, a layered approach that combines physical measures, software measures, and personal security practices is essential for protecting against a wide range of threats. By implementing these countermeasures, individuals and organizations can significantly reduce their risk and enhance their overall security posture.
IMPACT ON JOB SKILLS AND CAREERS
The Impact of Automation and Technology on Job Skills and Careers.
Automation and technological advancements have profoundly transformed the job market. From artificial intelligence (AI) to robotics, these technologies have reshaped how we work, the types of jobs available, and the skills required. This analysis delves into the effects of automation on job security, focusing on the balance between job loss and productivity gains in both skilled and unskilled job categories.
Automation and Job Security
Job Loss in Unskilled Job Categories
Displacement of Workers: Automation can displace workers in unskilled job categories by replacing repetitive and mundane tasks with machines and software. This shift can lead to significant job losses as businesses strive for efficiency and cost savings.
Reduced Demand for Unskilled Labor: The adoption of automated systems reduces the demand for unskilled labor. This can lead to higher unemployment rates among workers with limited skills, exacerbating economic inequality and social instability.
Economic Inequality: The displacement of unskilled workers can lead to financial instability for those who lose their jobs. The inability to find new employment opportunities may increase economic inequality, as displaced workers struggle to adapt to new labor market demands.
Productivity Gains in Unskilled Job Categories
Increased Efficiency: Automation enables tasks to be performed more quickly and accurately, leading to significant productivity gains. This increased efficiency can result in cost savings for businesses, which can be reinvested in other areas.
Cost Savings: Reducing labor costs through automation allows businesses to save money and reduce errors. These savings can lead to investments in innovation and the creation of new job opportunities in other sectors.
Improved Working Conditions: Automation can take over dangerous or monotonous tasks, improving working conditions for remaining employees. This can lead to higher job satisfaction and reduced turnover rates.
Job Loss in Skilled Job Categories
Automation of Complex Tasks: Advances in AI and machine learning have made it possible to automate complex tasks traditionally performed by skilled professionals. This can lead to job losses in fields such as software development, engineering, and healthcare.
Redefinition of Job Roles: Automation can redefine job roles in skilled professions, requiring workers to adapt to new technologies and learn new skills. Continuous learning and reskilling become essential to remain relevant in these fields.
Job Polarization: The automation of skilled tasks can contribute to job polarization, where high-skill, high-wage jobs and low-skill, low-wage jobs grow, while middle-skill jobs decline. This can lead to a more divided labor market.
Productivity Gains in Skilled Job Categories
Enhanced Capabilities: Automation can enhance the capabilities of skilled workers, allowing them to perform tasks more efficiently and accurately. AI-powered tools can assist in diagnosis, design, and data analysis, augmenting human capabilities.
Innovation and Growth: The integration of automation in skilled professions can drive innovation and growth. Companies can develop new products and services, leading to the creation of new job opportunities and the expansion of industries.
Focus on Higher-Value Tasks: Automation can take over routine and repetitive tasks, allowing skilled workers to focus on higher-value activities that require creativity, critical thinking, and problem-solving skills.
Balancing Job Loss and Productivity Gains
The impact of automation on job security is multifaceted, requiring careful consideration of both job loss and productivity gains. Policymakers, businesses, and workers must collaborate to navigate the challenges and opportunities presented by automation.
Strategies for Mitigating Job Loss
Reskilling and Upskilling: Providing training and education opportunities for workers to acquire new skills can help them transition to new roles in the evolving job market. Investment in lifelong learning and vocational training is crucial.
Support for Displaced Workers: Implementing support programs, such as unemployment benefits and job placement services, can help displaced workers find new employment opportunities. Social safety nets and career counseling play a vital role in this transition.
Promotion of New Job Creation: Encouraging innovation and the development of new industries can create job opportunities. Governments and businesses can work together to promote sectors that are likely to experience growth due to automation.
Fostering a Culture of Innovation: Encouraging a culture of innovation within organizations can help workers embrace new technologies and adapt to changing job requirements. This involves fostering an environment that values creativity, experimentation, and continuous improvement.
Conclusion
The impact of automation on job skills and careers is complex and multifaceted. While automation can lead to job losses, it also presents opportunities for productivity gains, innovation, and the creation of new job roles. Balancing these outcomes requires a collaborative effort from policymakers, businesses, and workers to ensure a smooth transition and to harness the full potential of technological advancements.
Impact on Job Skills and Careers in Information Technology
Network Engineer
Responsibilities: Design, implement, maintain, and troubleshoot network systems including LANs, WANs, and internet connections.
Skills Required: Knowledge of network protocols, hardware setup, network security measures, and problem-solving abilities.
Impact on Career: Critical for maintaining business operations and ensuring seamless communication across organizations.
Computer Programmer
Responsibilities: Write, test, and maintain code for software applications, working closely with software developers.
Skills Required: Proficiency in programming languages (Java, Python, C++), understanding of algorithms and data structures, debugging skills.
Impact on Career: Essential for developing functional software and applications used in various industries.
Computer Support Specialist
Responsibilities: Provide technical support to users, resolve hardware and software issues, and offer guidance on IT systems.
Skills Required: Strong communication skills, technical knowledge of hardware/software, patience, and problem-solving abilities.
Impact on Career: Ensure smooth IT operations and assist users in overcoming technical challenges.
Computer Systems Analyst
Responsibilities: Analyze and improve existing computer systems, integrate new technologies, and enhance system efficiency.
Skills Required: Analytical thinking, project management, understanding of IT infrastructure, and communication skills.
Impact on Career: Drive innovation and optimization within organizations, ensuring systems meet business needs.
Network, Systems, and Database Administrators
Responsibilities: Manage and maintain network infrastructure, system performance, and database integrity.
Skills Required: Technical expertise in network/system/database management, troubleshooting skills, and familiarity with security protocols.
Impact on Career: Crucial for data integrity, system reliability, and network performance in organizations.
Software Developer
Responsibilities: Design, develop, and test software applications, collaborate with cross-functional teams, and ensure software quality.
Skills Required: Coding proficiency, problem-solving skills, understanding of software development lifecycle, and creativity.
Impact on Career: Key players in creating innovative software solutions that drive business success.
Web Developer
Responsibilities: Build and maintain websites, ensure website functionality, and implement web design principles.
Skills Required: HTML, CSS, JavaScript, knowledge of web design tools, and user experience (UX) understanding.
Impact on Career: Vital for creating engaging and functional online presences for businesses.
Social Media Specialist
Responsibilities: Manage and create content for social media platforms, engage with audiences, and analyze social media metrics.
Skills Required: Creativity, communication skills, understanding of social media trends, and analytics tools.
Impact on Career: Enhance brand visibility and engage with customers through effective social media strategies.
The Impact of Information and Communication Technology (ICT) on Various Fields
In our modern world, the rapid advancements in Information and Communications Technology (ICT) have had profound economic implications across various fields. Here’s a comprehensive exploration of the impacts based on the Information Technology syllabus focusing on Education, Medicine, Business, Law Enforcement, and Recreation.
Education
Access to Information: ICT has revolutionized the way educational content is accessed and consumed. The internet serves as a vast repository of knowledge, enabling students and educators to access a wide range of information with ease. Digital libraries, academic journals, and online databases provide instant access to resources that were previously limited to physical locations.
Distance Teaching: One of the most significant impacts of ICT in education is the facilitation of distance learning. Online platforms and virtual classrooms have made it possible for students to attend classes and earn degrees from institutions worldwide, irrespective of their geographic location. This has opened up educational opportunities for individuals who might have been unable to attend traditional brick-and-mortar schools.
Collaborative Teaching and Learning: ICT tools such as interactive whiteboards, educational software, and online collaboration platforms have transformed the traditional classroom setting. These tools enable collaborative teaching and learning, allowing students to work together on projects, share ideas, and receive real-time feedback from their peers and instructors.
Plagiarism: The availability of information online has also led to concerns about plagiarism. With the ease of copying and pasting content, students might be tempted to present others’ work as their own. However, ICT has also provided tools to combat this issue, such as plagiarism detection software that helps educators identify instances of academic dishonesty.
Online Tutoring: The rise of online tutoring services has provided students with additional learning support outside the classroom. These platforms offer personalized tutoring sessions, enabling students to receive help in specific subjects or areas where they may be struggling. This has democratized access to quality education and support for learners of all ages.
Medicine
Access to Information for Medical Personnel and Patients: ICT has revolutionized the medical field by providing both healthcare professionals and patients with easy access to information. Medical databases, online journals, and health portals offer up-to-date information on medical research, treatments, and best practices. Patients can now educate themselves about their conditions and treatment options, leading to more informed discussions with their healthcare providers.
Telemedicine: Telemedicine has emerged as a powerful tool in modern healthcare. It allows healthcare professionals to diagnose and treat patients remotely using telecommunications technology. This is particularly beneficial for individuals living in remote areas or those with mobility issues. Telemedicine has expanded access to medical services, reduced travel time and costs, and improved patient outcomes.
eHealth (Online Access to Health Services): The concept of eHealth encompasses a wide range of services, including online appointment booking, electronic health records, and remote monitoring of patients’ health conditions. These services streamline administrative processes, improve the accuracy of medical records, and enhance the overall efficiency of healthcare delivery.
Implications for the Quality of Healthcare: The integration of ICT in healthcare has had significant implications for the quality of care provided. Electronic health records (EHRs) ensure that patient information is accurately recorded and easily accessible to healthcare providers, leading to better coordination of care. Additionally, ICT tools such as decision support systems assist doctors in making informed treatment decisions, reducing the likelihood of medical errors.
Increase in Self-Diagnosis: With the wealth of medical information available online, there has been an increase in self-diagnosis among patients. While this can be empowering, it also poses risks as individuals might misinterpret symptoms or rely on inaccurate information. Healthcare providers must educate patients on the importance of professional medical advice and the limitations of self-diagnosis.
Easy Access to Medical Expertise in Distant Locations (e.g., Teleradiology): Teleradiology is a prime example of how ICT facilitates access to medical expertise in distant locations. Radiologists can review and interpret medical images from any location, providing timely and accurate diagnoses to patients regardless of their physical location. This has improved access to specialized medical care and reduced the need for patients to travel long distances.
Business
E-commerce: The advent of e-commerce has transformed the way businesses operate. Companies can now sell their products and services online, reaching a global audience and operating 24/7. This has expanded market opportunities for businesses of all sizes and provided consumers with greater convenience and a wider range of choices.
Electronic Point of Sale (EPOS): EPOS systems have streamlined retail operations by automating sales transactions and inventory management. These systems provide real-time data on sales, stock levels, and customer preferences, enabling businesses to make informed decisions and improve operational efficiency. EPOS also enhances the customer experience by reducing wait times and ensuring accurate transactions.
Telecommuting: The rise of telecommuting, enabled by ICT, has reshaped the traditional workplace. Employees can now work from home or remote locations, thanks to high-speed internet, video conferencing, and collaboration tools. Telecommuting offers flexibility, reduces commuting time and costs, and can improve work-life balance. However, it also presents challenges such as maintaining productivity and ensuring effective communication among remote teams.
Email: Email remains a fundamental tool in business communication. It enables quick and efficient exchange of information, facilitates collaboration, and serves as a formal record of correspondence. Email has become an indispensable part of daily business operations, helping to streamline workflows and enhance communication both within and outside the organization.
Law Enforcement
E-surveillance: ICT has significantly enhanced law enforcement capabilities through e-surveillance. Technologies such as closed-circuit television (CCTV), automated license plate recognition, and facial recognition software help monitor public spaces, detect criminal activity, and identify suspects. E-surveillance has improved public safety and aided in the prevention and investigation of crimes.
Fingerprinting: Advancements in fingerprinting technology have revolutionized the field of forensic science. Automated fingerprint identification systems (AFIS) allow law enforcement agencies to quickly match fingerprints collected at crime scenes with existing databases. This has increased the accuracy and speed of criminal investigations, leading to more effective identification and apprehension of suspects.
Biometrics: Biometric technologies, such as facial recognition, iris scanning, and voice recognition, have become valuable tools in law enforcement. These technologies enhance identity verification and access control, making it easier to track and apprehend criminals. Biometrics also play a crucial role in border security, immigration control, and preventing identity fraud.
Recreation
Music: ICT has transformed the music industry in various ways. The rise of digital music platforms and streaming services has changed how music is distributed and consumed. Artists can now reach a global audience without the need for traditional record labels. Additionally, digital tools and software have revolutionized music production, allowing musicians to create, edit, and distribute their work more efficiently.
Gaming: The gaming industry has seen tremendous growth with the advent of ICT. Online gaming, virtual reality (VR), and augmented reality (AR) have created new avenues for entertainment and social interaction. Gamers can now connect with others worldwide, participate in multiplayer games, and experience immersive virtual environments. The development of sophisticated gaming software and hardware has pushed the boundaries of what is possible in interactive entertainment.
In conclusion, the impact of ICT on various fields is profound and far-reaching. From education and medicine to business, law enforcement, and recreation, ICT has transformed how we live, work, and interact with the world. These advancements have brought about numerous benefits, including increased access to information, improved efficiency, and enhanced quality of life. However, they also present challenges that must be addressed to ensure the responsible and equitable use of technology. As we continue to navigate the digital age, it is essential to harness the potential of ICT while being mindful of its implications for society.
Section Four: WORD-PROCESSING AND WEB PAGE DESIGN
WORD-PROCESSING
Word-Processing Skills
Introduction to Word Processing
Word processing is a fundamental skill in Information Technology, enabling users to create, edit, format, and print documents. These documents can range from simple text files to complex reports with images, tables, and various multimedia elements.
Creating a Document Using Content from Multiple Sources
To create a comprehensive document using content from various sources, follow these steps:
1. Importing Text (Combining Documents)
The process of importing text involves bringing content from different documents into a single file. This could include text from other word processing files, PDFs, or even online sources.
Steps to Import Text:
Open the Source Document:
Locate the document you want to import text from.
Open it using the relevant word processing software.
Select and Copy the Text:
Highlight the text you wish to import.
Use the copy function (Ctrl+C or Command+C).
Open the Destination Document:
Navigate to the document where you want to combine all the content.
Open it and position your cursor at the desired location.
Paste the Text:
Use the paste function (Ctrl+V or Command+V) to insert the copied text.
Ensure that the formatting aligns with the rest of the document.
2. Incorporating Typewritten Text, Images, and Other Objects
Beyond just text, documents often require the inclusion of images, charts, tables, and other multimedia elements to make them more informative and visually appealing.
Steps to Incorporate Various Elements:
Adding Typewritten Text:
Typewritten text refers to any manually entered content.
Ensure clarity and consistency in font, size, and style.
Use headings, subheadings, and bullet points to organize the content effectively.
Inserting Images:
Choose relevant images that complement the text.
Use the insert function in the word processor to add images (usually found in the “Insert” menu).
Resize and position the images appropriately within the document.
Add captions or alt text to describe the images, ensuring accessibility.
Incorporating Other Objects (Tables, Charts, etc.):
Tables: Use tables to present data systematically. Insert tables via the “Insert” menu and fill in the necessary data.
Charts: Visualize data using charts. Most word processors allow for chart insertion, where you can customize the type (e.g., bar, pie, line) and data points.
Hyperlinks: Add links to external resources or other sections of the document. Highlight the text and use the hyperlink function to embed URLs.
Multimedia: Embed videos or audio clips if supported by the word processor. This can be done through the “Insert” menu by selecting the appropriate media type.
Formatting and Finalizing the Document
Once all content has been incorporated, the next step is to format and finalize the document to ensure it is professional and polished.
Formatting Guidelines:
Consistency:
Maintain consistent font styles and sizes throughout the document.
Use appropriate spacing and alignment for readability.
Styles and Themes:
Apply styles and themes available in the word processor to give the document a cohesive look.
Customize headings, subheadings, and body text styles.
Proofreading:
Review the document for any grammatical or typographical errors.
Use spelling and grammar check tools provided by the word processor.
Table of Contents:
If the document is lengthy, include a table of contents for easy navigation.
Generate it automatically using the word processor’s Table of Contents function.
Headers and Footers:
Add headers and footers to display document title, page numbers, or author information.
Customize them as needed for different sections of the document.
Practical Application and Exercises
To reinforce these word-processing skills, here are a few practical exercises:
Exercise 1: Importing Text
Create a new document.
Import text from at least three different sources (documents or online).
Ensure the formatting is consistent throughout.
Exercise 2: Incorporating Multimedia
Add typewritten text to the document.
Insert images relevant to the content.
Embed a table and a chart to present data.
Add hyperlinks to external resources.
Exercise 3: Formatting and Finalizing
Apply a theme to the document.
Ensure consistent font styles and sizes.
Add a table of contents.
Include headers and footers.
Proofread the document for any errors.
Word-Processing and Document Formatting Features
1. Font Types and Sizes
Font Types: The choice of font type can greatly impact the readability and overall appearance of a document. Common font types include:
Serif (e.g., Times New Roman, Georgia) – known for their small lines at the ends of characters, often used in print media.
Sans-serif (e.g., Arial, Calibri) – without the small lines, often used for digital content due to better screen readability.
Monospaced (e.g., Courier New) – where each character takes up the same amount of space, useful for code and tabular data.
Display fonts (e.g., Impact, Comic Sans) – designed for large headings and not suitable for body text.
Font Sizes: The size of the font is typically measured in points (pt). Standard font sizes include:
12pt for body text in most documents.
Larger sizes (14pt, 16pt) for headings and subheadings.
Smaller sizes (10pt, 11pt) for footnotes and endnotes.
2. Colour
Text Colour: Changing the colour of the text can highlight important information or improve readability.
Background Colour: Using background colour to differentiate sections or to make text stand out.
3. Underline, Bold, Italics
Underline: Used for emphasis or to indicate hyperlinks.
Bold: To highlight important terms or headings.
Italics: Often used for titles of works, foreign words, or to emphasize certain words.
4. Superscript and Subscript
Superscript: Characters that are set slightly above the normal line of text (e.g., x² for squared).
Subscript: Characters that are set slightly below the normal line of text (e.g., H₂O for water).
5. Tab Stops
Tab Stops: Positions set within a document that allow for the alignment of text. Types of tab stops include:
Left tab: Text aligns to the left of the tab stop.
Center tab: Text centers around the tab stop.
Right tab: Text aligns to the right of the tab stop.
Decimal tab: Aligns numbers by their decimal points.
6. Bullets and Numbering
Bulleted Lists: Used for non-sequential items or lists where order does not matter.
Numbered Lists: Used for sequential items or lists where order is important.
7. Line Spacing
Single Spacing: No extra space between lines.
1.5 Lines: Halfway between single and double spacing.
Double Spacing: Creates extra space between lines for readability or for leaving room for comments.
8. Justification
Left Justification: Text aligns to the left margin.
Right Justification: Text aligns to the right margin.
Center Justification: Text is centered between the margins.
Full Justification: Text is aligned evenly along both the left and right margins, creating a clean look.
9. Highlight
Highlighting: Changing the background color of text to emphasize it. Useful for marking important sections.
10. Uppercase
Uppercase Text: All letters are capitalized. It can be used for headings or to draw attention.
11. Word Wrap
Word Wrap: Automatically moving a word to the next line when it will not fit on the current line. This ensures text fits within the margins.
12. Page Size
Page Size: Determining the dimensions of the page (e.g., A4, Letter). Common sizes include:
A4: 210mm x 297mm.
Letter: 8.5 inches x 11 inches.
Legal: 8.5 inches x 14 inches.
13. Margins
Margins: The blank spaces around the edges of the page. Adjusting margins can affect the amount of text on a page.
14. Page and Section Breaks
Page Break: Used to start a new page at a specific point in the document.
Section Break: Divides the document into sections, allowing for different formatting in each section (e.g., different headers/footers).
15. Page Numbers
Page Numbers: Adding page numbers helps in navigating large documents. They can be placed at the top or bottom of the page.
16. Headers and Footers
Headers: Text or graphics that appear at the top of every page (e.g., document title).
Footers: Text or graphics that appear at the bottom of every page (e.g., page number, date).
17. Footnotes and Endnotes
Footnotes: Notes at the bottom of a page that provide additional information or citations.
Endnotes: Notes at the end of a document that provide additional information or citations.
Each of these formatting features can be used to enhance the presentation and readability of documents in word-processing software. By mastering these features, users can create professional and well-organized documents suitable for various purposes.
Word-Processing Skills and Techniques
1. Use Appropriate Editing Features to Structure and Organize a Document
Word-processing software offers various editing features that help structure and organize content efficiently. These features enhance the readability and presentation of documents:
Text Formatting: Adjusting font type, size, color, and style (bold, italics, underline) to highlight key information.
Paragraph Formatting: Aligning text (left, right, center, justify), setting line spacing, and creating indents for better text flow.
Styles: Using predefined or custom styles for headings, subheadings, and body text to maintain consistency throughout the document.
Headers and Footers: Adding headers and footers to include page numbers, document titles, and author information.
Section Breaks: Dividing documents into sections to apply different formatting or layout options.
Page Layout: Adjusting margins, orientation (portrait or landscape), and paper size for optimal printing.
2. Drag and Drop Editing: Perform Block Operations on Selected Areas of Text within a Document
Drag and drop editing is a convenient way to move or copy text within a document. Here are the steps and benefits of this feature:
Selecting Text: Click and drag the mouse pointer to highlight the text block.
Moving Text: Click and hold the selected text, drag it to the desired location, and release the mouse button.
Copying Text: Hold the ‘Ctrl’ key (or ‘Cmd’ key on Mac) while dragging the text to copy it to a new location.
Benefits of drag and drop editing include:
Efficiency: Quickly rearrange content without using cut, copy, and paste commands.
Precision: Place text exactly where needed with visual feedback.
3. Use Search and Replace Functions Appropriately to Edit a Document
The search and replace function is a powerful tool for editing large documents. It allows users to find specific words or phrases and replace them with new text. Here’s how it works:
Search Function: Open the search dialog box (usually ‘Ctrl+F’ or ‘Cmd+F’), enter the text to find, and navigate through the occurrences.
Replace Function: Open the replace dialog box (usually ‘Ctrl+H’ or ‘Cmd+H’), enter the text to find and the replacement text, and choose ‘Replace’ or ‘Replace All.’
Applications:
Correcting Errors: Quickly correct spelling or grammatical mistakes throughout the document.
Updating Information: Replace outdated terms or names with current information.
Formatting Consistency: Apply consistent formatting to specific words or phrases.
4. Use of Tables, Table Styles, Shading, Borders, Row and Column Insertion, Split Cells, Split Tables, Text Direction, and Cell Margins, Cell Size
Tables are essential for organizing data and presenting information clearly. Word-processing software offers various features to enhance table design and functionality:
Creating Tables: Insert tables with a specified number of rows and columns.
Table Styles: Apply predefined styles for a professional look, including color schemes, border styles, and shading.
Shading and Borders: Customize cell shading and borders to highlight key data or improve visual appeal.
Row and Column Insertion: Add or delete rows and columns to adjust the table layout.
Split Cells: Divide a cell into multiple cells for more detailed data entry.
Split Tables: Separate a table into two distinct tables for better organization.
Text Direction: Change the orientation of text within cells (e.g., vertical text for narrow columns).
Cell Margins: Adjust the padding within cells for better text alignment.
Cell Size: Modify the height and width of cells to accommodate content.
5. Use of Columns (One, Two, Three, Left and Right Columns, Column Breaks)
Columns are used to divide text into vertical sections, enhancing readability and layout. Here are the key aspects of using columns in word processing:
Creating Columns: Choose from one, two, or three columns to organize text in a newspaper-style format.
Left and Right Columns: Use left or right columns for sidebars or pull quotes.
Column Breaks: Insert column breaks to control where columns begin and end, allowing for precise content placement.
Applications:
Newsletters: Create professional-looking newsletters with multiple columns.
Brochures: Design brochures with columns for a clean and organized appearance.
Reports: Use columns to present complex information in a structured manner.
Advanced Features of Word Processing Software
Review Features of a Word Processor
Spell and Grammar Check: These tools automatically detect and highlight spelling and grammatical errors in a document. This feature enhances readability and ensures that the content is professionally presented. Correcting these errors is crucial for maintaining credibility and clear communication.
Thesaurus: A thesaurus helps users find synonyms and antonyms for words in their document. This tool is particularly useful for enhancing vocabulary, avoiding repetition, and improving the overall quality of writing.
Word Count: The word count feature provides a count of words, characters, and sometimes paragraphs and lines in a document. This is essential for meeting specific length requirements set by guidelines or assignments.
Language Setting: This feature allows users to set the language of the document. It ensures that spellcheck and grammar tools operate correctly for the selected language. Additionally, it can adjust the display language of the user interface and the formatting of dates and numbers.
Comments: Comments are annotations that users can add to specific parts of a document without altering the actual text. They are often used in collaborative environments to provide feedback, ask questions, or suggest changes.
Track Changes: This feature allows users to make and view edits without losing the original content. Changes are marked in the document, showing insertions, deletions, and formatting modifications. This is particularly useful in collaborative work, enabling others to review and accept or reject changes.
Document Protection Features
Automatic Save and Backup Copy: Word processors often include an autosave feature that saves the document at regular intervals. This helps prevent data loss due to unexpected shutdowns or crashes. Additionally, creating backup copies ensures that previous versions of the document are preserved.
Edit Restrictions – Password Protection: Edit restrictions allow users to limit the actions that others can perform on a document. Password protection can prevent unauthorized access or editing of the document. This is vital for maintaining the integrity and confidentiality of sensitive information.
Generating Table of Contents
Auto Table of Contents: This feature automatically generates a table of contents (TOC) based on the document’s headings. It provides a structured overview of the document, allowing readers to navigate through sections easily. The TOC is dynamic and can be updated as changes are made to the document.
Mail Merge Feature
Creation of Primary Documents and Data Files: Mail merge combines a primary document (e.g., a letter) with a data file (e.g., a spreadsheet) to generate personalized versions of the document for each recipient. The primary document contains placeholders, while the data file provides the variable information.
Field Names: Field names are placeholders in the primary document that correspond to data fields in the data file. During the mail merge process, these placeholders are replaced with actual data, creating customized documents for each entry in the data file.
Creating Fillable Electronic Forms
Content Controls: Content controls are interactive elements that users can add to a document to create fillable forms. These can include check boxes, text boxes, date pickers, drop-down lists, and command buttons. They allow users to input information directly into the form electronically.
By incorporating these features, word-processing tools enable users to create, edit, and manage documents efficiently and effectively. Each feature plays a specific role in enhancing the document’s functionality and usability, making word processors indispensable tools in both academic and professional settings.
WEB PAGE DESIGN
Web Page Design – PRACTICAL
This section equips students with practical skills in web design tools to create a simple website. Students should be able to:
Plan the structure and organization of a website page.
Design simple web pages using various design features (HTML coding is not required).
They should consider the following:
Reasons for the website
The intended audience
Number of web pages desired (no more than 3)
Content of each page
Layout of the web page
Selecting an appropriate design for a page
Inserting and deleting text and graphics
Wrapping text around images
Creating a homepage with hyperlinks
Specific Objectives for Web Page Design
Students should be able to:
Insert hyperlinks within different locations of a web page.
Evaluate a website for accuracy, user-friendliness, and effective display.
Content
Link to another web page.
Link to a location within the same web page.
Link to an email address.
Link to user-created files.
Considerations for Publishing a Website
Verify that all hyperlinks work correctly.
Use a test audience.
Ensure that all content is up-to-date.
Section Five: SPREADSHEETS

Introduction to Spreadsheets
Definition and Purpose
A spreadsheet is a digital document consisting of cells organized in rows and columns. These cells can hold various types of data, such as text, numbers, dates, and formulas. The main purposes of spreadsheets include:
Data Organization: Structuring large amounts of data in an easily readable format.
Data Analysis: Performing complex calculations, statistical analysis, and data manipulation.
Data Visualization: Creating charts and graphs to represent data visually.
Core Components of Spreadsheets
Cells, Rows, and Columns
Cells: The basic unit where data is entered. Each cell is identified by a unique combination of column letter and row number (e.g., A1, B2).
Rows: Horizontal groupings of cells, labeled numerically.
Columns: Vertical groupings of cells, labeled alphabetically.
Data Types
Spreadsheets can handle various types of data, including:
Text: Letters, words, and other non-numeric characters.
Numbers: Numeric data used for calculations.
Dates and Times: Specific formats to handle calendar dates and clock times.
Formulas: Expressions that perform calculations on other cells’ data.
Functions and Formulas
Basic Functions
SUM(): Adds up a range of numbers.
AVERAGE(): Calculates the mean value of a range.
MIN() and MAX(): Finds the smallest and largest values in a range.
COUNT(): Counts the number of cells with numerical data.
IF(): Performs conditional logic, returning different values based on a test.
Advanced Functions
VLOOKUP() and HLOOKUP(): Search for a value in a table.
INDEX() and MATCH(): More flexible lookup functions that can be combined.
TEXT(): Converts numbers to text, or formats numbers as text.
DATE() and TIME(): Functions for handling dates and times.
Data Manipulation
Sorting and Filtering
Sorting: Arranges data in a specified order (e.g., ascending or descending).
Filtering: Displays only rows that meet specific criteria, hiding others.
Data Validation
Ensures data entry meets specific criteria, preventing errors.
Common validation rules include restricting entry to numbers within a range, dates, or predefined lists.
Data Visualization
Charts and Graphs
Bar and Column Charts: Compare data across categories.
Line Charts: Show trends over time.
Pie Charts: Display data as proportions of a whole.
Scatter Plots: Show the relationship between two variables.
Spreadsheet Applications
Financial Modeling
Budgeting and Forecasting: Planning future income and expenses.
Investment Analysis: Evaluating potential returns on investments.
Profit and Loss Statements: Summarizing revenue, costs, and profits.
Business Operations
Inventory Management: Tracking stock levels and orders.
Sales Analysis: Monitoring sales performance and trends.
Project Management: Planning tasks, resources, and timelines.
Personal Use
Home Budgeting: Managing household finances.
Fitness Tracking: Monitoring exercise and health metrics.
Event Planning: Organizing events with timelines and budgets.
Spreadsheet Software
Popular Spreadsheet Programs
Microsoft Excel: The industry standard with powerful features.
Google Sheets: Web-based and collaborative tool.
LibreOffice Calc: Free, open-source alternative.
Apple Numbers: Spreadsheet software for Mac users.
Spreadsheet Best Practices
Data Entry and Organization
Consistent Data Entry: Using the same format for similar data.
Clear Labels and Headings: Ensuring easy understanding of data.
Use of Templates: Starting with a pre-designed template for common tasks.
Efficiency Tips
Keyboard Shortcuts: Speeding up data entry and navigation.
Named Ranges: Simplifying formulas by naming cell ranges.
Conditional Formatting: Automatically formatting cells based on their values.
Advanced Spreadsheet Techniques
Macros and Automation
Macros: Recorded actions that can be played back to automate repetitive tasks.
Scripting: Writing code to automate complex tasks (e.g., VBA for Excel, Google Apps Script).
Pivot Tables
Creating Pivot Tables: Summarizing large datasets dynamically.
Customizing Pivot Tables: Adjusting rows, columns, and data to display specific information.
Spreadsheet Security
Protecting Data
Password Protection: Restricting access to the spreadsheet or specific sheets.
Cell Locking: Preventing changes to specific cells.
Data Backup
Regularly saving and backing up spreadsheet files to prevent data loss.
Conclusion
Spreadsheets are versatile and powerful tools essential for managing and analyzing data in various contexts. Whether for personal finance, business operations, or academic research, understanding the full range of spreadsheet capabilities can significantly enhance productivity and decision-making.
Introduction to Spreadsheets; Cont’d
Spreadsheets are essential tools in various fields such as finance, accounting, data analysis, and project management. They allow users to organize, analyze, and visualize data in a structured manner. A spreadsheet consists of a grid of cells arranged in rows and columns, where each cell can contain data such as numbers, text, or formulas.
Key Terminologies and Notions
Workbook: A workbook is a file that contains one or more worksheets. It serves as the container for all the data, calculations, and analyses that you perform in a spreadsheet application. In software like Microsoft Excel, a workbook is represented by a single file with the extension .xlsx or .xls.
Worksheet: A worksheet, also known as a spreadsheet, is a single sheet within a workbook. It consists of a grid of cells organized in rows and columns. Each worksheet can have its own set of data, calculations, and charts. Users can navigate between different worksheets in a workbook using tabs located at the bottom of the screen.
Column: Columns are vertical divisions in a worksheet, labeled with letters (A, B, C, etc.). Columns run from top to bottom and are used to categorize data in a specific way. For example, in a financial spreadsheet, one column might contain dates, another might contain transaction descriptions, and another might contain amounts.
Row: Rows are horizontal divisions in a worksheet, labeled with numbers (1, 2, 3, etc.). Rows run from left to right and are used to represent individual data entries. Each row typically corresponds to a single record or observation in the dataset.
Cell: A cell is the intersection of a column and a row, identified by a unique address (e.g., A1, B2). Cells are the basic units of a worksheet where data is entered. They can contain different types of data, including:
Cell Address: The unique identifier of a cell, combining the column letter and row number (e.g., A1, B2). This address is used to reference the cell in formulas and functions.
Range: A range is a group of adjacent cells, identified by the addresses of the top-left and bottom-right cells (e.g., A1:B10). Ranges are used to perform operations on multiple cells simultaneously.
Label: A label is text entered into a cell, typically used for headings or descriptions. Labels help users understand the context of the data in the worksheet.
Value: A value is numerical data entered into a cell. Values are used for calculations and data analysis. They can include integers, decimals, dates, and times.
Formula: A formula is an expression entered into a cell that performs calculations based on the data in other cells. Formulas can include mathematical operators (e.g., +, -, *, /), cell references, and functions. For example, the formula
=A1+B1
adds the values in cells A1 and B1.Function: Functions are predefined formulas that perform specific calculations using the data in a worksheet. Spreadsheet applications come with a wide range of built-in functions for different purposes, such as:
SUM: Adds the values in a range of cells. For example,
=SUM(A1:A10)
adds the values in cells A1 through A10.AVERAGE: Calculates the average (mean) of the values in a range of cells. For example,
=AVERAGE(A1:A10)
finds the average of the values in cells A1 through A10.MAX: Finds the maximum value in a range of cells. For example,
=MAX(A1:A10)
identifies the highest value in cells A1 through A10.MIN: Finds the minimum value in a range of cells. For example,
=MIN(A1:A10)
identifies the lowest value in cells A1 through A10.IF: Performs a logical test and returns one value if the test is true and another if it is false. For example,
=IF(A1>10, "High", "Low")
returns “High” if the value in A1 is greater than 10, and “Low” otherwise.
Common Features of Spreadsheets
Spreadsheets offer a wide range of features to enhance data management, analysis, and presentation. Some of the most commonly used features include:
Data Entry and Formatting: Users can enter data directly into cells and format it to improve readability and presentation. Formatting options include font styles, cell colors, borders, and number formats (e.g., currency, percentage, date).
Sorting and Filtering: Spreadsheets allow users to sort data in ascending or descending order based on the values in a specific column. Filtering enables users to display only the rows that meet certain criteria, making it easier to focus on relevant data.
Charts and Graphs: Spreadsheets can generate visual representations of data in the form of charts and graphs. Common types of charts include bar charts, line charts, pie charts, and scatter plots. These visualizations help users identify trends, patterns, and outliers in the data.
Conditional Formatting: Conditional formatting applies formatting rules to cells based on their values. For example, users can highlight cells with values above a certain threshold in red or apply a different color scale based on the cell values. This feature helps users quickly identify important data points.
Pivot Tables: Pivot tables are powerful tools for summarizing and analyzing large datasets. They allow users to group, filter, and aggregate data in various ways, providing insights that are not immediately apparent from the raw data.
Data Validation: Data validation ensures that users enter valid and consistent data into cells. It can restrict the type of data (e.g., numbers, dates) or the range of acceptable values (e.g., between 1 and 100). This feature helps maintain data integrity and reduces errors.
Formulas and Functions: As mentioned earlier, formulas and functions are essential for performing calculations and data analysis in spreadsheets. Users can create complex formulas that combine multiple functions and cell references to achieve their desired results.
Collaboration: Modern spreadsheet applications, such as Google Sheets and Microsoft Excel Online, support real-time collaboration. Multiple users can work on the same workbook simultaneously, making it easier to share information and collaborate on projects.
Macros and Automation: Spreadsheets can automate repetitive tasks using macros, which are sequences of actions recorded by the user. Macros can be triggered by specific events (e.g., opening a workbook) or run manually. Automation helps save time and reduces the risk of errors in complex workflows.
Spreadsheets and Basic Pre-Defined System Functions
1. SUM Function
Purpose: The SUM function is used to add together a range of numbers in a spreadsheet.
Syntax:
=SUM(number1, number2, ...)
or=SUM(range)
Example:
=SUM(A1:A10)
adds all the numbers in cells A1 through A10.Use Case: Calculate the total sales for a given period.
2. AVERAGE Function
Purpose: The AVERAGE function calculates the mean of a set of numbers.
Syntax:
=AVERAGE(number1, number2, ...)
or=AVERAGE(range)
Example:
=AVERAGE(B1:B10)
calculates the average of the numbers in cells B1 through B10.Use Case: Determine the average test score of students in a class.
3. DATE Function
Purpose: The DATE function creates a date value from individual year, month, and day components.
Syntax:
=DATE(year, month, day)
Example:
=DATE(2025, 1, 12)
returns January 12, 2025.Use Case: Convert separate year, month, and day values into a single date.
4. MAX Function
Purpose: The MAX function returns the largest number in a set of values.
Syntax:
=MAX(number1, number2, ...)
or=MAX(range)
Example:
=MAX(C1:C10)
finds the highest number in cells C1 through C10.Use Case: Identify the highest score in a game.
5. MIN Function
Purpose: The MIN function returns the smallest number in a set of values.
Syntax:
=MIN(number1, number2, ...)
or=MIN(range)
Example:
=MIN(D1:D10)
finds the lowest number in cells D1 through D10.Use Case: Determine the minimum temperature recorded in a week.
6. COUNT Function
Purpose: The COUNT function counts the number of cells that contain numbers in a range.
Syntax:
=COUNT(value1, value2, ...)
or=COUNT(range)
Example:
=COUNT(E1:E10)
counts the number of numeric values in cells E1 through E10.Use Case: Count the number of sales transactions in a list.
7. COUNTA Function
Purpose: The COUNTA function counts the number of cells that are not empty in a range.
Syntax:
=COUNTA(value1, value2, ...)
or=COUNTA(range)
Example:
=COUNTA(F1:F10)
counts the number of non-empty cells in cells F1 through F10.Use Case: Count the number of entries in a list that includes both text and numbers.
8. COUNTIF Function
Purpose: The COUNTIF function counts the number of cells that meet a specific condition.
Syntax:
=COUNTIF(range, criteria)
Example:
=COUNTIF(G1:G10, ">50")
counts the number of cells in cells G1 through G10 that contain a value greater than 50.Use Case: Count the number of students who scored above a certain mark.
9. VLOOKUP Function
Purpose: The VLOOKUP function searches for a value in the first column of a range and returns a value in the same row from a specified column.
Syntax:
=VLOOKUP(lookup_value, table_array, col_index_num, [range_lookup])
Example:
=VLOOKUP("Apple", A1:B10, 2, FALSE)
searches for “Apple” in the first column of the range A1:B10 and returns the value in the second column of the same row.Use Case: Look up product prices based on product names.
10. PMT Function
Purpose: The PMT function calculates the periodic payment for a loan based on constant payments and a constant interest rate.
Syntax:
=PMT(rate, nper, pv, [fv], [type])
Example:
=PMT(0.05/12, 60, -20000)
calculates the monthly payment for a loan of $20,000 with an annual interest rate of 5% over 5 years.Use Case: Determine the monthly mortgage payment for a home loan.
11. IF Function
Purpose: The IF function performs a logical test and returns one value if the test is true and another value if the test is false.
Syntax:
=IF(logical_test, value_if_true, value_if_false)
Example:
=IF(H1>50, "Pass", "Fail")
returns “Pass” if the value in cell H1 is greater than 50, otherwise it returns “Fail”.Use Case: Determine whether students passed or failed based on their scores.
Applications of Spreadsheet Functions
These functions are essential tools that enhance the functionality of spreadsheets and make data analysis and management more efficient.
Here’s a more detailed look at some practical applications and examples:
Financial Analysis
Budgeting: Using SUM, AVERAGE, and PMT functions to track expenses, calculate averages, and plan loan repayments.
Investment Tracking: VLOOKUP to fetch stock prices, MAX and MIN to identify highest and lowest values over time.
Data Management
Employee Records: COUNTA to count the number of employees, DATE to track hiring dates.
Inventory Control: COUNTIF to monitor stock levels, IF to reorder items based on stock quantity.
Education
Grade Calculation: AVERAGE to calculate student averages, IF to assign grades based on score ranges.
Attendance: COUNT to tally the number of classes attended, DATE to record attendance dates.
Advanced Tips
Combining Functions: Nesting functions like
=IF(SUM(A1:A10)>100, "Target Met", "Target Not Met")
for more complex calculations.Absolute References: Using
$
to create absolute references in formulas (e.g.,=SUM($A$1:$A$10)
), ensuring the same range is used even when formulas are copied to other cells.
Conclusion
Mastering these basic pre-defined system functions in spreadsheets empowers you to handle a wide range of tasks more efficiently. Whether you’re managing finances, analyzing data, or organizing information, these functions provide a solid foundation for effective spreadsheet use.
Advanced Arithmetic Formulae in Spreadsheets
Spreadsheets are essential tools in Information Technology for managing and analyzing data. They offer a range of functionalities, but one of the most powerful features is their ability to perform complex calculations using formulae. In this section, we will delve into the basics and advanced techniques for creating arithmetic formulae.
1. Basic Arithmetic Operations
Spreadsheets can perform basic arithmetic operations such as addition, subtraction, multiplication, and division. Here are examples of each:
Addition: To add two numbers, you use the
+
operator. Example:=A1 + B1
adds the values in cells A1 and B1.Subtraction: To subtract one number from another, you use the
-
operator. Example:=A1 - B1
subtracts the value in cell B1 from A1.Multiplication: To multiply two numbers, you use the
*
operator. Example:=A1 * B1
multiplies the values in cells A1 and B1.Division: To divide one number by another, you use the
/
operator. Example:=A1 / B1
divides the value in cell A1 by B1.
2. Using Parentheses in Formulas
Parentheses are used to control the order of operations in formulas. Operations within parentheses are performed first. This is crucial for ensuring that calculations are performed correctly.
Example:
=(A1 + B1) * C1
ensures that the sum of A1 and B1 is calculated before multiplying by C1.
3. Complex Calculations
Spreadsheets are capable of handling more complex calculations by combining multiple operators and functions. Here are some examples:
Combining Operations: You can create formulas that combine different arithmetic operations. Example:
=(A1 + B1) / (C1 - D1)
calculates the sum of A1 and B1 and then divides it by the difference between C1 and D1.Nested Functions: You can nest functions within other functions to perform advanced calculations. Example:
=SUM(A1:A10) / COUNT(A1:A10)
calculates the average of the values in the range A1:A10.
4. Common Spreadsheet Functions
In addition to arithmetic operations, spreadsheets offer a variety of built-in functions that simplify complex calculations. Some of the most commonly used functions include:
SUM: Adds all the numbers in a range of cells. Example:
=SUM(A1:A10)
calculates the sum of the values in the range A1 to A10.AVERAGE: Calculates the average of a range of numbers. Example:
=AVERAGE(A1:A10)
calculates the average of the values in the range A1 to A10.MIN and MAX: Find the smallest and largest number in a range of cells. Example:
=MIN(A1:A10)
finds the smallest number in the range A1 to A10. Example:=MAX(A1:A10)
finds the largest number in the range A1 to A10.COUNT: Counts the number of cells that contain numbers in a range. Example:
=COUNT(A1:A10)
counts the number of cells in the range A1 to A10 that contain numbers.
5. Error Handling in Formulas
Spreadsheets can sometimes produce errors in formulas due to incorrect input or calculations. Understanding common errors and how to handle them is important:
#DIV/0!: This error occurs when a formula attempts to divide by zero.
Solution: Ensure that the divisor is not zero.
#VALUE!: This error occurs when a formula has the wrong type of argument.
Solution: Check that all cell references and data types are correct.
#NAME?: This error occurs when a formula contains text that is not recognized.
Solution: Verify that all function names and cell references are spelled correctly.
#REF!: This error occurs when a formula references a cell that is not valid.
Solution: Check for deleted or moved cells that the formula is referencing.
6. Using Relative and Absolute Cell References
Understanding cell references is crucial for creating flexible and dynamic formulas:
Relative Cell References: Adjust automatically when the formula is copied to another cell. Example:
=A1 + B1
changes to=A2 + B2
when copied to the next row.Absolute Cell References: Remain constant regardless of where the formula is copied. Example:
=$A$1 + B1
ensures that A1 is always referenced, even if the formula is copied to another cell.Mixed Cell References: Combine absolute and relative references. Example:
=$A1 + B$1
keeps column A constant and row 1 constant, respectively.
7. Using Named Ranges
Named ranges allow you to assign a name to a specific range of cells, making formulas easier to read and manage:
Example: If you name the range A1:A10 as “Sales”, you can use the formula
=SUM(Sales)
instead of=SUM(A1:A10)
.
8. Data Analysis Tools
Spreadsheets come with various tools that help in analyzing data more effectively:
Pivot Tables: Summarize large datasets by creating customizable tables.
Example: Create a pivot table to summarize sales data by region and product.
Charts and Graphs: Visualize data using different chart types such as bar, line, and pie charts.
Example: Create a bar chart to compare monthly sales figures.
Conditional Formatting: Apply formatting based on specific conditions.
Example: Highlight cells with sales figures above a certain threshold.
Data Validation: Ensure that the data entered into a cell meets specific criteria.
Example: Set up data validation to only allow dates within a certain range.
9. Advanced Functions
For more complex data manipulation and analysis, spreadsheets offer advanced functions:
IF Function: Performs a logical test and returns one value for a TRUE result and another for a FALSE result. Example:
=IF(A1 > 10, "High", "Low")
returns “High” if A1 is greater than 10, otherwise “Low”.VLOOKUP and HLOOKUP: Look up values in a table or range by row (VLOOKUP) or column (HLOOKUP). Example:
=VLOOKUP("Product1", A1:B10, 2, FALSE)
looks up “Product1” in the range A1:B10 and returns the corresponding value from the second column.INDEX and MATCH: More flexible alternatives to VLOOKUP and HLOOKUP. Example:
=INDEX(A1:A10, MATCH("Product1", B1:B10, 0))
finds “Product1” in the range B1:B10 and returns the corresponding value from the range A1:A10.TEXT Functions: Manipulate text strings. Example:
=CONCATENATE(A1, " ", B1)
combines the contents of cells A1 and B1 with a space in between.
10. Macros and Automation
For repetitive tasks, you can use macros to automate processes in spreadsheets:
Recording Macros: Record a sequence of actions to be replayed later.
Example: Record a macro to format a report with specific fonts, colors, and borders.
Writing Macros in VBA: For more advanced automation, you can write macros using Visual Basic for Applications (VBA).
Example: Write a VBA macro to generate a monthly sales report.
11. Collaboration and Sharing
Spreadsheets offer collaboration features that allow multiple users to work on the same document simultaneously:
Sharing and Permissions: Share spreadsheets with others and control their access permissions (view, edit, comment).
Example: Share a budget spreadsheet with your team and allow them to edit specific sections.
Comments and Notes: Add comments and notes to cells to provide context or feedback.
Example: Add a comment to a cell to explain a complex formula.
Version History: Track changes and restore previous versions of the spreadsheet.
Example: Use version history to recover a previous version of a financial model.
In conclusion, mastering spreadsheets requires a solid understanding of arithmetic formulae, functions, data analysis tools, and automation techniques. By leveraging these features, you can efficiently manage and analyze data, make informed decisions, and improve productivity in various fields.
Replicating (Copying) Formulae into Other Cells
Relative Addressing
Relative addressing refers to the way in which a cell reference changes when a formula is copied to another cell. For example, if you have a formula =A1+B1
in cell C1
, and you copy it to C2
, it will automatically adjust to =A2+B2
.
Usage: Relative addresses are used when you want the formula to adapt based on its new location. This is particularly useful for operations that involve patterns or sequences, such as summing columns or performing operations on rows of data.
Example: If cell
D2
has the formula=B2+C2
and it is copied down toD3
, it will change to=B3+C3
, and so on.
Absolute Addressing
Definition: Absolute addressing involves keeping a specific cell reference constant, even when the formula is copied to another cell. This is achieved by adding dollar signs (
$
) to the cell reference (e.g.,$A$1
).Usage: Absolute addresses are used when a specific value or cell reference needs to remain unchanged across multiple cells. This is essential for formulas that rely on a constant value, such as a tax rate or a fixed price.
Example: If
E2
contains the formula=$A$1+B2
and it is copied toE3
, it will still refer toA1
as$A$1
remains fixed, whileB2
will adjust toB3
.
Naming of Ranges
Definition: Named ranges allow users to assign a meaningful name to a cell or a range of cells. This makes formulas easier to read and manage.
Usage: Naming ranges is particularly helpful in complex spreadsheets where the same range of cells is referenced multiple times. Instead of using cell references like
A1:A10
, you can use a name likeSalesData
.Example: If you name the range
A1:A10
asSalesData
, you can use=SUM(SalesData)
instead of=SUM(A1:A10)
.
Effect of Move, Copy, Delete Operations on Formulae
Move: When cells are moved, formulas that reference those cells will automatically adjust to reflect the new location of the moved cells.
Copy: When cells are copied, the original formula remains intact, but the copied formula adapts based on relative or absolute references.
Delete: When cells are deleted, any formulas referencing those cells will display an error, such as
#REF!
, indicating that the reference is no longer valid.
Manipulating Columns and Rows
Insert Columns and Rows
Definition: Inserting columns or rows adds new columns or rows to the spreadsheet, shifting existing data accordingly.
Usage: This operation is useful when additional data needs to be included without overwriting existing data.
Example: If you insert a new column between columns
B
andC
, the new column will be labeledC
, and the original columnC
will shift toD
.
Delete Columns and Rows
Definition: Deleting columns or rows removes them from the spreadsheet, shifting any remaining data to fill the gap.
Usage: This operation is used to remove unnecessary or outdated data.
Example: If you delete column
D
, all columns to the right will shift left, andD
will be removed from the spreadsheet.
Modify Columns and Rows
Definition: Modifying columns and rows includes changing their width, height, or visibility (hiding/unhiding).
Usage: Modifications improve the readability and organization of the spreadsheet.
Example: Adjusting the column width to fit the content ensures that all data is visible and well-organized.
Manipulating Data in a Spreadsheet
Numeric Data Formatting
Currency: Formats numbers as monetary values, adding currency symbols like
$
or€
.Accounting: Similar to currency formatting but aligns currency symbols and decimal points in columns.
Percentage: Converts numbers to percentages by multiplying by 100 and adding a
%
symbol.Comma: Adds thousand separators to large numbers for readability.
Decimal Places: Adjusts the number of decimal places displayed for numeric values.
Sorting Data
Primary Field: The main criterion by which data is sorted.
Secondary Field: Additional criteria for sorting when primary field values are identical.
Ascending Order: Sorts data from smallest to largest or from
A
toZ
.Descending Order: Sorts data from largest to smallest or from
Z
toA
.
Filtering Data
Multiple Criteria: Applying more than one condition to filter data.
Complex Criterion: Using advanced conditions, such as
AND
,OR
, andNOT
, to filter data.
Pivot Table
Create One and Two-Dimensional Pivot Tables: Summarize and analyze data by organizing it into a pivot table, allowing for multi-level analysis.
Create Frequency Distribution from Data: Use a pivot table to create a frequency distribution, showing how often different values occur.
Create Pivot Chart: Generate charts from pivot table data for visual analysis.
Charting Operations
Charting is a visual representation of data within a spreadsheet, crucial for interpreting and presenting data effectively. Here are the key points to master:
Selecting Appropriate Chart Types
Column Charts: Best for showing data changes over a period of time or comparing different items. Each category of data is represented by vertical columns.
Bar Charts: Similar to column charts but use horizontal bars. They are ideal for comparing multiple values across different categories.
Line Graphs: Useful for tracking changes over periods of time, particularly when the data points are numerous and the interval is small.
Pie Charts: Excellent for showing proportional data and percentages, giving a clear picture of how parts make up a whole.
Labelling Charts
Graph Titles: Clearly describe what the chart is about. The title should be concise but descriptive enough to inform the viewer of the chart’s purpose.
Labels on Axes: Ensure that the x-axis and y-axis are properly labeled to indicate what data is being represented. This includes units of measurement where applicable.
Data Labels: These are the numbers or values shown on the chart, which indicate the data points’ exact values. They make it easier to understand the exact representation of data without referring back to the data table.
Worksheet Manipulation
Manipulating worksheets in a spreadsheet involves organizing and linking data to solve complex problems.
Here’s what you need to know:
Using Multiple Worksheets
Solving Problems with Worksheets: Use different worksheets within the same workbook to organize data efficiently. Each worksheet can contain different parts of the problem you’re trying to solve. For example, one worksheet might have raw data, while another could contain calculations or summaries.
Linking Worksheets: You can link data between worksheets to create a dynamic and interconnected data model. This allows you to perform calculations and reference data across multiple sheets. For example, if you have sales data on one sheet and inventory data on another, you can link them to calculate turnover rates or forecast demand.
The world of spreadsheets is vast, and mastering these concepts will definitely give you a solid foundation. Charting helps in visual data representation, making it easier to understand and convey insights. Manipulating worksheets, on the other hand, allows for sophisticated data management and analysis.
Charting Operations: Deep Dive
Column Charts
Column charts are one of the most commonly used types of charts in spreadsheets. They are easy to understand and effectively display data changes over time.
Advantages: Column charts can clearly show trends over specific periods. They are ideal for comparing multiple series of data points.
Disadvantages: They can become cluttered and hard to read if there are too many data points or categories.
Example: If you’re tracking sales performance over several months, column charts will show the rise and fall of sales figures effectively.
Bar Charts
Bar charts are similar to column charts but have horizontal bars. They are particularly useful when dealing with categories that have long names.
Advantages: Easier to read when you have long category names. They provide a clear comparison of different categories.
Disadvantages: Not suitable for showing time-based data trends.
Example: When comparing the performance of different branches of a store, a bar chart can help visualize which branch is performing best.
Line Graphs
Line graphs are best for displaying data trends over time, especially when dealing with large datasets.
Advantages: Show trends clearly and can handle multiple data series.
Disadvantages: Can become cluttered if too many lines are used.
Example: Tracking the daily temperature changes over a year is best visualized with a line graph.
Pie Charts
Pie charts are excellent for showing proportions within a dataset. They are visually appealing and easy to understand.
Advantages: Clearly show the parts of a whole.
Disadvantages: Not useful for comparing multiple data points or showing trends over time.
Example: Displaying the market share of different companies in an industry can be effectively done with a pie chart.
Labelling Charts: Best Practices
Graph Titles: Always make your titles descriptive. Instead of “Sales Data”, use “Monthly Sales Data for 2024”.
Labels on Axes: Include units of measurement. If you’re tracking temperature, label the y-axis as “Temperature (°C)”.
Data Labels: Use data labels to provide specific values on your charts. This is especially useful in pie charts and bar charts, where exact numbers can add significant context.
Manipulating Worksheets: Advanced Techniques
Using One or More Worksheets to Solve Problems
Organize Data Logically: Keep raw data separate from processed data. Use one worksheet for raw data and others for summaries, calculations, and visualizations.
Consistency is Key: Ensure consistent formatting across worksheets. This includes using the same date formats, number formats, and text styles.
Example: In a budget spreadsheet, one sheet could contain detailed expenses and another could summarize monthly totals.
Linking Worksheets
Linking worksheets allows for dynamic data analysis and makes your workbook more efficient.
How to Link: Use formulas like
=Sheet1!A1
to link data from one sheet to another. This allows for real-time updates; if the data in Sheet1 changes, the linked cell will automatically update.Scenarios for Linking:
Budgeting: Link expense data from different departments to a master budget sheet.
Inventory Management: Link inventory levels from multiple locations to a central tracking sheet.
Example: If you have sales data in one sheet and inventory data in another, you can use the SUMIF function to sum up inventory levels based on sales.
Tips for Mastering Spreadsheets
Practice Regularly: The more you work with spreadsheets, the more comfortable you’ll become with different functions and operations.
Use Keyboard Shortcuts: Learn and use keyboard shortcuts to save time and increase efficiency.
Stay Organized: Keep your data organized. Use clear and consistent naming conventions for sheets, cells, and ranges.
Learn Advanced Functions: Functions like VLOOKUP, HLOOKUP, INDEX, and MATCH can be extremely powerful for data analysis.
Use Conditional Formatting: This feature allows you to format cells based on certain conditions, making it easier to highlight important data.
Conclusion
Understanding charting operations and worksheet manipulation is fundamental for efficient spreadsheet usage. Properly selecting and labelling charts can make a significant difference in how data is perceived and understood. Meanwhile, effective manipulation of worksheets enables sophisticated problem-solving and data analysis.
Section Six: DATABASE MANAGEMENT
Definition
A database is essentially a well-structured, organized collection of information. It acts as a repository where data is stored, accessed, and managed. Here are the key components to understanding a database:
Repository of Information: At its core, a database serves as a centralized storehouse where vast amounts of information can be saved and efficiently retrieved. Think of it as a sophisticated library where every piece of data has a designated place.
Collection of Related Tables: Databases are structured to comprise multiple tables. Each table contains records (rows) and fields (columns) which store data in an organized manner. These tables are interrelated via keys, forming a cohesive structure that facilitates complex data retrieval and manipulation.
Purpose of Databases
The main purpose of databases is to provide a method for storing and retrieving data in a reliable and efficient manner. Here’s why databases are pivotal in the realm of information technology:
Data Management: They enable organizations to manage large volumes of data effortlessly. Databases support operations like data insertion, updates, deletion, and querying with high efficiency and low error rates.
Data Integrity: By using constraints and relationships, databases ensure the accuracy and consistency of data. This means fewer errors and discrepancies in the data being handled.
Security: Databases provide robust security mechanisms to protect data from unauthorized access and breaches. Access controls, encryption, and user authentication are standard features.
Scalability: Databases can handle growing amounts of data and users. They are designed to scale out (distribute across multiple servers) or scale up (increase power of a single server) as needed.
Data Sharing and Collaboration: Databases support multi-user environments, allowing multiple users to access and manipulate data simultaneously. This is crucial for collaboration in large organizations.
Types of Databases
There are several types of databases, each suited to different applications and requirements:
Relational Databases (RDBMS): These are the most common type. They use structured query language (SQL) for defining and manipulating data. Examples include MySQL, PostgreSQL, and Oracle.
NoSQL Databases: Designed for specific data models and have flexible schemas. Ideal for big data and real-time web applications. Examples are MongoDB, Cassandra, and Redis.
In-Memory Databases: Store data in a computer’s main memory (RAM) for faster access. Used for applications requiring real-time data processing. Examples include SAP HANA and Memcached.
Object-Oriented Databases: Store data in the form of objects, similar to object-oriented programming. Examples are ObjectDB and db4o.
Graph Databases: Use graph structures for semantic queries. Well-suited for complex relationships between data points. Examples include Neo4j and Amazon Neptune.
Database Models
Database models define the logical structure of a database and determine how data can be stored, organized, and manipulated. Here are the primary models:
Hierarchical Model: Data is organized into a tree-like structure. Each record has a single parent and zero or more children. Though less common now, it’s used in some legacy systems.
Network Model: Similar to the hierarchical model, but allows each record to have multiple parents. It supports many-to-many relationships.
Relational Model: The most popular model, it organizes data into tables (relations) which can be linked by common fields. This model supports SQL.
Entity-Relationship Model: Visual representation of the relational model. Entities represent tables, and relationships depict how tables are related.
Object-Oriented Model: Data is represented as objects, similar to classes in object-oriented programming. Objects can store both data and procedures.
Document Model: Data is stored in documents, typically in JSON or XML format. Each document can have a different structure.
Database Design
Good database design is crucial for efficiency, accuracy, and performance. Here are key principles:
Normalization: The process of organizing data to reduce redundancy and improve data integrity. It involves dividing large tables into smaller ones and defining relationships between them.
Data Integrity: Ensuring data accuracy and consistency through constraints, such as primary keys, foreign keys, unique constraints, and check constraints.
Indexing: Creating indexes to improve the speed of data retrieval. Indexes are similar to book indexes that help you quickly locate information.
Data Modeling: Creating data models to represent the structure of the database. This involves defining tables, fields, data types, and relationships.
Entity-Relationship Diagrams (ERDs): Visual tools used to model the data. They show the entities involved and the relationships between them.
Database Management Systems (DBMS)
A DBMS is software that interacts with the database, end-users, and applications to capture and analyze data. Here are some key components and functions of a DBMS:
Data Definition Language (DDL): Used to define database structures, such as tables, indexes, and constraints.
Data Manipulation Language (DML): Used to insert, update, delete, and retrieve data.
Data Control Language (DCL): Used to control access to data. This includes commands like GRANT and REVOKE.
Transaction Management: Ensures that all database operations are completed successfully before committing the changes, maintaining data integrity.
Concurrency Control: Manages simultaneous data access to ensure data consistency. It prevents issues like deadlocks and data corruption.
Backup and Recovery: DBMS provides mechanisms for data backup and recovery to protect against data loss and corruption.
SQL (Structured Query Language)
SQL is the standard language for interacting with relational databases. Here are some key SQL operations:
SELECT: Retrieves data from one or more tables.
sqlSELECT * FROM employees;
INSERT: Adds new data to a table.
sqlINSERT INTO employees (name, position) VALUES ('John Doe', 'Manager');
UPDATE: Modifies existing data in a table.
sqlUPDATE employees SET position = 'Senior Manager' WHERE name = 'John Doe';
DELETE: Removes data from a table.
sqlDELETE FROM employees WHERE name = 'John Doe';
CREATE: Defines a new table or database structure.
sqlCREATE TABLE employees ( id INT PRIMARY KEY, name VARCHAR(50), position VARCHAR(50) );
ALTER: Modifies an existing database structure.
sqlALTER TABLE employees ADD COLUMN salary DECIMAL(10, 2);
DROP: Deletes a table or database.
sqlDROP TABLE employees;
Advanced Database Concepts
Here are some advanced concepts in database management:
Stored Procedures: Predefined SQL code that can be saved and reused. They improve efficiency and security.
sqlCREATE PROCEDURE GetEmployeeDetails AS SELECT * FROM employees;
Triggers: SQL code automatically executed in response to certain events on a table, such as inserts, updates, or deletes.
sqlCREATE TRIGGER UpdateEmployeeLog AFTER UPDATE ON employees FOR EACH ROW BEGIN INSERT INTO employee_log (employee_id, change_date) VALUES (NEW.id, NOW()); END;
Views: Virtual tables created by querying one or more tables. They simplify complex queries and enhance security.
sqlCREATE VIEW EmployeeView AS SELECT name, position FROM employees;
Transactions: A sequence of operations performed as a single unit of work. Transactions ensure data consistency and integrity.
sqlBEGIN TRANSACTION; INSERT INTO employees (name, position) VALUES ('Jane Doe', 'Developer'); COMMIT;
Emerging Trends
The field of database management is constantly evolving. Here are some emerging trends:
Big Data: Handling massive amounts of data generated by applications, sensors, social media, and more. Technologies like Hadoop and Spark are used for big data processing.
Cloud Databases: Storing and managing databases in the cloud. Services like Amazon RDS, Google Cloud SQL, and Azure SQL Database offer scalable and cost-effective solutions.
Artificial Intelligence: Using AI to automate database management tasks, improve query optimization, and enhance security.
Blockchain: Distributed ledger technology that ensures data integrity and transparency. Used in applications requiring high levels of trust and security.
Graph Databases: Gaining popularity for applications involving complex relationships, such as social networks and recommendation engines.
Conclusion
Databases are the backbone of modern information systems. They provide a structured way to store, retrieve, and manage data, ensuring accuracy, consistency, and security. As technology advances, the role of databases continues to evolve, with new models and trends emerging to meet the ever-growing demands of data-driven applications.
Database Terminology
Table: The basic structure in a relational database, which consists of rows and columns. Each table represents a specific entity or concept and stores data in a structured format. For example, a table named “Students” might contain columns like “StudentID,” “Name,” and “DateOfBirth.”
Row (Record): A single entry in a table, representing a specific instance of the entity. Each row contains data for each column defined in the table. In the “Students” table, a row would represent one student with their respective data.
Column (Field): Defines the type of data stored in the table. Each column has a specific data type, such as text, numeric, or date/time. For example, the “Name” column in the “Students” table would store text data.
Primary Key: A unique identifier for each row in a table. It ensures that no two rows have the same value in this field. The primary key is crucial for maintaining the integrity of the database. In the “Students” table, “StudentID” might be the primary key.
Secondary Key: An additional key used to create indexes that can speed up data retrieval. While not unique, it provides a way to sort and query data more efficiently.
Candidate Key: Any column or set of columns that could potentially serve as the primary key. It must contain unique and non-null values. The primary key is chosen from these candidate keys.
Foreign Key: A column or set of columns in one table that references the primary key in another table. It creates a relationship between the two tables. For example, a “CourseEnrollments” table might use a “StudentID” foreign key to reference the “Students” table.
Data Types
Numeric: Used to store numerical data, including integers and floating-point numbers. Examples include “Age” and “Grade” columns.
Text: Stores alphanumeric characters. It’s used for columns like “Name” and “Address.”
Logical: Represents Boolean values, i.e., true or false. This is useful for binary choices, such as “IsEnrolled.”
Date/Time: Stores dates and times. Columns like “DateOfBirth” and “EnrollmentDate” would use this data type.
Currency: Stores monetary values. It’s often used in financial tables to track amounts like “TuitionFee” and “ScholarshipAmount.”
Types of Database Management Systems (DBMS)
Hierarchical DBMS: Organizes data in a tree-like structure where each record has a single parent and potentially many children. It’s efficient for specific types of data queries but less flexible for complex relationships.
Network DBMS: Similar to hierarchical but allows records to have multiple parent-child relationships, forming a graph structure. This enhances flexibility and can better model more complex relationships.
Relational DBMS (RDBMS): The most common type of DBMS, which organizes data into tables (relations) and uses SQL (Structured Query Language) for database management. It supports powerful querying and complex relationships through primary and foreign keys.
Object-oriented DBMS: Incorporates object-oriented programming principles into the database. Data is stored as objects, similar to how it’s represented in object-oriented languages like Java or C++. This DBMS is ideal for applications requiring complex data and relationships.
Key Concepts in DBMS
Normalization: The process of organizing data to minimize redundancy and improve data integrity. Normalization involves dividing a database into two or more tables and defining relationships between them. It typically goes through several stages called normal forms (1NF, 2NF, 3NF, etc.).
Denormalization: The process of combining tables to reduce the complexity of queries and improve performance. It can sometimes lead to data redundancy but can be necessary for efficiency.
Indexes: Used to speed up the retrieval of data by creating an ordered data structure based on one or more columns. Indexes can significantly improve query performance but may slow down data modification operations.
Transactions: A sequence of database operations that are treated as a single logical unit of work. Transactions must follow ACID properties: Atomicity, Consistency, Isolation, and Durability.
Views: A virtual table created based on the result-set of a query. Views do not store data physically but provide a way to present data from one or more tables. They can simplify complex queries and enhance security by restricting user access to specific data.
Stored Procedures: A set of SQL statements that can be stored in the database and executed as a single unit. They help in reducing client-server communication, improving performance, and maintaining code consistency.
Triggers: Procedures that automatically execute in response to certain events on a particular table or view. They are often used for enforcing data integrity, auditing changes, or implementing business rules.
Database Design and Modeling
Entity-Relationship (ER) Model: A conceptual representation of data that focuses on entities, their attributes, and the relationships between them. It’s often used during the database design phase to create a blueprint for the actual database.
Entities: Objects or concepts that represent data stored in the database. Examples include “Students,” “Courses,” and “Teachers.”
Attributes: Properties or characteristics of an entity. For the “Students” entity, attributes might include “StudentID,” “Name,” and “DateOfBirth.”
Relationships: Connections between entities that describe how data in one entity relates to data in another. For instance, a “One-to-Many” relationship between “Teachers” and “Courses,” where one teacher can teach multiple courses.
Cardinality: Defines the numerical relationship between rows of related tables. It includes types like “One-to-One,” “One-to-Many,” and “Many-to-Many.”
Primary and Foreign Keys: As discussed earlier, these keys are crucial in establishing and maintaining relationships between tables in a relational database.
Normalization and Denormalization: As previously mentioned, these processes are essential for efficient database design and performance.
Advanced Database Concepts
Data Warehousing: A large repository of structured data used for reporting and analysis. Data warehouses integrate data from multiple sources and are optimized for query performance and data analysis.
Data Mining: The process of discovering patterns and relationships in large datasets. It involves techniques like clustering, classification, and regression to extract meaningful insights from data.
Big Data: Refers to extremely large datasets that cannot be easily managed, processed, or analyzed using traditional database tools. Big data technologies like Hadoop and NoSQL databases are used to handle and analyze such data.
NoSQL Databases: Non-relational databases designed to handle large volumes of unstructured or semi-structured data. They provide flexibility in data modeling and are often used for big data applications. Examples include MongoDB, Cassandra, and Redis.
Cloud Databases: Databases hosted on cloud computing platforms, offering scalability, flexibility, and cost-effectiveness. They can be managed by cloud service providers or the users themselves. Examples include Amazon RDS, Google Cloud SQL, and Microsoft Azure SQL Database.
Distributed Databases: A collection of interconnected databases spread across multiple locations. They provide data availability, reliability, and scalability, often used in large-scale applications.
Database Security
Authentication and Authorization: Ensuring that only authorized users have access to the database and its resources. Authentication verifies the identity of users, while authorization defines their permissions and access levels.
Encryption: The process of converting data into a secure format to prevent unauthorized access. Data can be encrypted at rest (stored data) and in transit (data being transferred).
Backup and Recovery: Regularly creating copies of the database to protect against data loss. Backup strategies include full, incremental, and differential backups. Recovery procedures are essential to restore data in case of failures or disasters.
Audit Trails: Recording and monitoring database activities to detect and investigate security breaches or compliance violations. Audit trails help track changes, access, and usage of the database.
Firewalls and Network Security: Implementing firewalls and security measures to protect the database from external threats. This includes configuring network security settings, monitoring traffic, and blocking unauthorized access.
Trends and Future Directions
Artificial Intelligence and Machine Learning: Integrating AI and ML technologies with databases to enhance data processing, analysis, and decision-making. AI-driven databases can automate tasks, optimize performance, and provide predictive insights.
Blockchain Technology: Leveraging blockchain for secure, decentralized data management. Blockchain databases provide transparency, immutability, and tamper-proof records, making them suitable for applications like supply chain management and digital identity verification.
Edge Computing: Moving data processing closer to the source of data generation (e.g., IoT devices) to reduce latency and bandwidth usage. Edge databases are designed to handle real-time data processing at the edge of the network.
Quantum Computing: Exploring the potential of quantum computing to solve complex database problems and optimize query performance. Quantum databases could revolutionize data management and analysis.
Data Privacy and Compliance: Increasing focus on data privacy regulations (e.g., GDPR, CCPA) and ensuring databases comply with legal and ethical standards. This includes implementing data anonymization, consent management, and privacy-preserving techniques.
Database Creation and Management
1. Introduction to Databases
A database is an organized collection of data that can be easily accessed, managed, and updated. Databases are used in a wide range of applications to store and retrieve data efficiently. A well-structured database ensures data integrity, security, and scalability for handling complex data structures.
2. Creating a Database
Creating a database involves several steps, including defining its structure, choosing the appropriate data types, and establishing relationships among different entities.
Key Steps in Database Creation:
- Defining the Purpose of the Database: Determine what the database will store and how the data will be used.
- Identifying Tables: Tables are the primary structure for storing data in a relational database. Each table represents an entity.
- Designing Table Structures: Define the fields (columns) in each table along with their data types.
- Populating Data: Enter at least 25 records into the tables for testing and functionality.
3. Table Structure
A table is the backbone of any database. It consists of rows and columns, where each column represents a specific attribute of an entity, and rows represent individual records.
Components of a Table:
- Fields (Columns): Define the attributes of the data, such as
Name
,Age
, orEmail
. - Records (Rows): Represent individual entries in a table.
- Primary Key: A unique identifier for each record in the table.
Example Table Structure:
Data Types:
Data types specify the kind of data a column can hold.
Common Data Types:
- Integer: Whole numbers, e.g.,
Age
. - Varchar/String: Text data, e.g.,
Name
,Email
. - Boolean: True/False values.
- Date/Time: Dates and times.
- Float/Decimal: Numbers with decimals, e.g.,
Price
. - Blob: Binary large objects for storing multimedia.
4. Populating Tables
Once the table structure is defined, data is added to populate the database. This ensures the database can be tested for functionality and performance.
Steps to Populate a Table:
- Use SQL
INSERT
statements or database management tools. - Ensure data adheres to field constraints, such as data types and length restrictions.
- Add meaningful and diverse records to represent real-world scenarios.
Example:
INSERT INTO Students (StudentID, Name, Age, Email)
VALUES (1, 'Alice Johnson', 20, 'alice@example.com');
INSERT INTO Students (StudentID, Name, Age, Email)
VALUES (2, 'Bob Smith', 22, 'bob@example.com');
5. Modifying Table Structure
Database requirements evolve over time, necessitating modifications to the table structure. This can include adding new fields, deleting fields, or changing field definitions.
5.1 Adding New Fields:
New fields can be added to accommodate additional data attributes.
Example:
ALTER TABLE Students
ADD Address VARCHAR(255);
5.2 Deleting Fields:
Fields no longer needed can be removed to maintain database efficiency.
Example:
ALTER TABLE Students
DROP COLUMN Address;
5.3 Changing Field Definitions:
Field properties, such as data type or length, can be modified.
Example:
ALTER TABLE Students
MODIFY Age INT(3);
6. Establishing Primary Keys
A primary key is a unique identifier for each record in a table. It ensures that no two rows have the same value in the primary key column.
Characteristics of Primary Keys:
- Must be unique.
- Cannot contain null values.
- Enforces entity integrity.
Defining a Primary Key:
- During Table Creation:
CREATE TABLE Students (
StudentID INT PRIMARY KEY,
Name VARCHAR(100),
Age INT
);
- After Table Creation:
ALTER TABLE Students
ADD PRIMARY KEY (StudentID);
7. Establishing Relationships
Relationships define how tables in a database are connected. They are crucial for maintaining data integrity and minimizing redundancy.
Types of Relationships:
One-to-One:
- Each record in Table A is related to one record in Table B.
- Example: A
Person
table linked to aPassport
table. - Implementation:
CREATE TABLE Person ( PersonID INT PRIMARY KEY, Name VARCHAR(100) ); CREATE TABLE Passport ( PassportID INT PRIMARY KEY, PersonID INT, FOREIGN KEY (PersonID) REFERENCES Person(PersonID) );
One-to-Many:
- A record in Table A can be related to multiple records in Table B.
- Example: A
Department
table linked to anEmployees
table. - Implementation:
CREATE TABLE Department ( DeptID INT PRIMARY KEY, DeptName VARCHAR(100) ); CREATE TABLE Employees ( EmployeeID INT PRIMARY KEY, DeptID INT, FOREIGN KEY (DeptID) REFERENCES Department(DeptID) );
Many-to-Many:
- Records in Table A can be associated with multiple records in Table B and vice versa.
- Example: A
Students
table linked to aCourses
table via anEnrollment
table. - Implementation:
CREATE TABLE Students ( StudentID INT PRIMARY KEY, Name VARCHAR(100) ); CREATE TABLE Courses ( CourseID INT PRIMARY KEY, CourseName VARCHAR(100) ); CREATE TABLE Enrollment ( StudentID INT, CourseID INT, PRIMARY KEY (StudentID, CourseID), FOREIGN KEY (StudentID) REFERENCES Students(StudentID), FOREIGN KEY (CourseID) REFERENCES Courses(CourseID) );
Conclusion
Creating and managing databases involves understanding table structures, data types, relationships, and modifications. These components ensure data is organized, consistent, and accessible for various applications. Mastery of these concepts forms the foundation for building robust and scalable database systems.
These notes provide a comprehensive understanding of database creation and management, aligned with Information Technology syllabus standards.
Manipulating Data in a Database
Manipulating data in a database refers to the process of creating, managing, and modifying data using forms, queries, and other database tools. This skill is essential for managing information systems efficiently and effectively.
The section can be broken into two major components:
- Forms
- Queries
Each component involves specific techniques and tools to ensure data is accurately and appropriately handled.
Forms
Forms are tools in a database system that allow users to input, view, and modify data in a structured and user-friendly manner. A well-designed form streamlines data entry, reduces errors, and enhances productivity.
The following topics cover essential aspects of forms:
(i) Use of Form Wizard Only
The Form Wizard is a feature in many database management systems (DBMS) such as Microsoft Access. It simplifies the creation of forms by guiding the user step-by-step through the process.
Steps to Create a Form Using the Wizard:
- Select the table or query that contains the data you want to use.
- Launch the Form Wizard from the database tools.
- Choose the fields you want to include in the form.
- Decide on the layout of the form (e.g., columnar, tabular, datasheet, or justified).
- Select a style or theme for the form.
- Name the form and click “Finish.”
Advantages of Using the Form Wizard:
- Saves time by automating the design process.
- Ensures a consistent and professional appearance.
- Reduces the likelihood of errors in form creation.
(ii) Select Suitable Fields
When designing a form, selecting the appropriate fields is crucial to ensure that the form fulfills its purpose.
Tips for Selecting Suitable Fields:
- Include only the necessary fields to avoid clutter and confusion.
- Prioritize fields that users interact with frequently, such as primary keys, foreign keys, or fields requiring user input.
- Arrange fields logically, e.g., grouping related fields together.
- Use field labels and descriptions to enhance usability.
Example:
- In a student database, a form for student registration might include fields such as:
- Student ID (Primary Key)
- Name
- Date of Birth
- Contact Information
- Program of Study
- In a student database, a form for student registration might include fields such as:
(iii) Use of Sub-Forms
Sub-forms are forms embedded within another form. They are used to display related data from different tables or queries.
Purpose of Sub-Forms:
- To display one-to-many relationships. For example, a main form may display customer information, and a sub-form may display orders placed by the customer.
- To provide a more comprehensive view of related data without switching between different forms or views.
Creating Sub-Forms:
- Use the Form Wizard to create both the main form and the sub-form.
- Specify the relationship between the main form and the sub-form using the primary and foreign keys.
- Embed the sub-form within the main form, ensuring it is correctly linked.
Advantages of Sub-Forms:
- Enables users to view and edit related data in a single interface.
- Enhances data integrity by maintaining relationships.
Queries
Queries are tools used to retrieve, analyze, and manipulate data stored in a database. They allow users to filter, calculate, and transform data based on specific criteria. Queries are powerful and essential for extracting meaningful information from large datasets.
(i) More Than One Criterion
Queries can use multiple criteria to filter data. Criteria are conditions that data must meet to be included in the query results.
Types of Criteria:
- Text Criteria: Filters based on specific text, e.g., “City = ‘New York’.”
- Numerical Criteria: Filters based on numerical values, e.g., “Age > 25.”
- Date Criteria: Filters based on dates, e.g., “OrderDate > #01/01/2023#.”
Combining Criteria:
- AND Operator: All conditions must be true. Example:
- “Age > 25 AND City = ‘New York’.”
- OR Operator: At least one condition must be true. Example:
- “Age > 25 OR City = ‘New York’.”
- AND Operator: All conditions must be true. Example:
(ii) Use of SELECT
The SELECT query is the most fundamental type of query. It is used to retrieve specific data from a table.
Syntax:
SELECT column1, column2 FROM table_name WHERE condition;
Examples:
- Retrieve all records:
SELECT * FROM Students;
- Retrieve specific fields:
SELECT FirstName, LastName FROM Students;
- Retrieve records with a condition:
SELECT * FROM Students WHERE Age > 25;
- Retrieve all records:
(iii) Use of Calculated Field
A calculated field is a virtual field created by performing calculations on other fields in the database.
Purpose:
- To derive new data from existing data.
- To reduce the need for repetitive manual calculations.
Example:
- Adding a calculated field to find the total price of an order:
SELECT ProductName, Quantity, UnitPrice, Quantity * UnitPrice AS TotalPrice FROM Orders;
- Adding a calculated field to find the total price of an order:
Benefits:
- Simplifies reporting and data analysis.
- Ensures consistency in calculations.
(iv) Two or More Fields Involving the Use of Relational and Logical Operators
Relational and logical operators allow users to build complex queries by combining multiple fields and conditions.
Relational Operators:
=
(Equal to)!=
or<>
(Not equal to)<
(Less than)>
(Greater than)<=
(Less than or equal to)>=
(Greater than or equal to)
Logical Operators:
AND
OR
NOT
Example Query:
- Find students who are older than 25 and live in “New York”:
SELECT * FROM Students WHERE Age > 25 AND City = 'New York';
- Find students who are older than 25 or live in “New York”:
SELECT * FROM Students WHERE Age > 25 OR City = 'New York';
- Find students who are older than 25 and live in “New York”:
Combining Multiple Fields: Queries can involve calculations or comparisons between two or more fields. For example:
SELECT FirstName, LastName, Salary FROM Employees WHERE Bonus > Salary * 0.1;
Practical Applications
- Data Validation: Forms and queries play a vital role in ensuring data is entered correctly and validated at multiple stages.
- Data Analysis: Queries allow users to analyze trends, generate reports, and extract insights.
- Reporting: With calculated fields and advanced queries, users can generate professional-grade reports directly from the database.
Summary
Mastering forms and queries is essential for effective database manipulation. Forms simplify data entry and management, while queries enable robust data retrieval and analysis. By applying the concepts outlined above, database users can enhance their efficiency, accuracy, and overall performance in handling data.
Reports
1. Introduction to Reports
Definition: A report is a structured document that presents data in a readable and organized format for analysis, decision-making, or record-keeping.
Purpose of Reports in Databases:
- To summarize and analyze data.
- To present insights for decision-making.
- To distribute data in a professional and understandable format.
- To meet specific business or academic requirements.
2. Key Features of Reports
- User-friendly design for easy data interpretation.
- Integration with database systems to automatically generate dynamic and up-to-date information.
- Flexibility in customization, including formatting and calculations.
3. (i) Use of Report Wizard
What is a Report Wizard?
- A tool in database management systems (DBMS) that simplifies the process of creating reports.
- Provides step-by-step guidance to users, enabling even beginners to create reports efficiently.
Advantages of Using the Report Wizard:
- Saves time by automating repetitive tasks.
- Reduces errors by guiding users through a predefined process.
- Offers predefined templates for various report types.
Steps in Using the Report Wizard:
- Selecting the Source Data: Choose the database table or query containing the data for the report.
- Choosing the Layout: Decide how the data will be displayed (e.g., tabular, columnar, or grouped).
- Applying Sorting and Grouping: Organize data to enhance readability and focus on key metrics.
- Customizing the Appearance: Add colors, fonts, and other visual elements to make the report professional.
- Preview and Finalize: Review the generated report and make necessary adjustments.
4. (ii) Use of Sorting, Grouping, Statistical, and Summary Features
Sorting:
- Organizes data in ascending or descending order based on one or more fields.
- Examples:
- Sorting student records by grades.
- Arranging product sales by revenue.
Grouping:
- Combines related data into categories or groups for clarity.
- Examples:
- Grouping employees by department.
- Categorizing expenses by type (e.g., travel, utilities).
Statistical Features:
- Enable the inclusion of mathematical operations to analyze data.
- Commonly used statistics:
- Count: Displays the total number of records.
- Sum: Calculates the total of numeric fields.
- Average: Computes the mean value for numeric data.
Summary Features:
- Provide an overview of data trends and patterns.
- Examples:
- Total sales in a month.
- Average scores across all students.
Importance in Reports:
- Enhances decision-making by highlighting key metrics.
- Simplifies complex datasets into comprehensible summaries.
5. (iii) Report Generation to Screen, Printer, and File
Report Generation to Screen:
- Displays the report directly on the user’s monitor.
- Useful for immediate review and on-the-spot decision-making.
- Features:
- Interactive options for zooming and scrolling.
- Real-time data refresh for dynamic reports.
Report Generation to Printer:
- Converts reports into a printable format.
- Ensures compatibility with various printers.
- Key considerations:
- Use page setup tools to manage margins and layout.
- Select high-quality paper for professional presentations.
Report Generation to File:
- Saves reports in digital formats for storage and sharing.
- Common file formats:
- PDF: Preserves formatting and is widely compatible.
- Excel: Allows further data manipulation.
- Word: Facilitates editing and customization.
- Benefits:
- Ensures easy distribution through email or cloud storage.
- Maintains a backup for future reference.
6. (iv) Renaming of Report Title
Importance of Report Titles:
- The title provides a quick understanding of the report’s purpose.
- Reflects the content and scope of the report.
Steps to Rename a Report Title:
- Open the report in design or layout view.
- Locate the title field, usually positioned at the top of the report.
- Edit the text to reflect the desired title.
- Save the changes to update the report.
Best Practices for Report Titles:
- Be concise and specific (e.g., “Monthly Sales Report”).
- Include the date or time period covered for context.
- Use a professional and consistent format across reports.
7. Applications of Reports in Real-World Scenarios
- Business:
- Tracking sales performance.
- Analyzing customer behavior.
- Education:
- Monitoring student progress.
- Generating attendance records.
- Healthcare:
- Summarizing patient visits.
- Reporting on medical inventory.
- Government:
- Managing census data.
- Budget allocation and expenditure tracking.
8. Challenges in Report Creation
- Ensuring data accuracy and consistency.
- Balancing detail with simplicity to avoid overwhelming users.
- Managing report performance with large datasets.
9. Future Trends in Report Management
- Integration with artificial intelligence for predictive insights.
- Enhanced visualization tools (e.g., interactive dashboards).
- Increased focus on real-time reporting for agile decision-making.
Section Seven: PROBLEM-SOLVING AND PROGRAM DESIGN
Problem-Solving and Program Design
1. Steps in Problem-Solving
Problem-solving in Information Technology involves a structured approach to identify, analyze, and resolve issues efficiently. Here is a detailed breakdown of the key steps:
a. Define the Problem
- Objective: Clearly articulate the issue that needs to be addressed.
- Importance: Establishes a common understanding among all stakeholders to prevent misinterpretation.
- Approach:
- Use flowcharts or diagrams to visually represent the issue.
- Conduct interviews or surveys with stakeholders to gather insights.
- Create a problem statement that includes the problem’s scope, limitations, and impact.
Example: A university’s online portal crashes during peak registration hours. The problem definition could include: “The system’s inability to handle concurrent users beyond a certain threshold.”
b. Propose and Evaluate Solutions
- Proposing Solutions: Brainstorm multiple ways to address the problem.
- Evaluating Solutions: Assess the pros and cons of each solution using:
- Feasibility (Can it be implemented with available resources?)
- Cost (Does the solution fit the budget?)
- Time (How quickly can it be implemented?)
- Scalability (Can it handle future growth?)
Techniques:
- SWOT Analysis: Identifies Strengths, Weaknesses, Opportunities, and Threats.
- Cost-Benefit Analysis: Quantifies the financial implications of each solution.
c. Determine the Most Efficient Solution
- Choose the solution that balances effectiveness, cost, time, and scalability.
- Ensure the solution aligns with the organization’s goals and constraints.
d. Develop the Algorithm
- Definition: An algorithm is a step-by-step set of instructions designed to solve a problem.
- Components of an Algorithm:
- Input: Data required to execute the solution.
- Process: Steps to transform the input into the desired output.
- Output: The result or solution to the problem.
Algorithm Representation Techniques:
Flowcharts:
- Symbols:
- Oval: Start/End
- Rectangle: Process
- Diamond: Decision
- Arrow: Flow
Example Flowchart for a Simple Decision-Making Process:
[Start] --> [Is the input even?] --> (Yes) --> [Output: Even Number] --> [End] | (No) --> [Output: Odd Number] --> [End]
- Symbols:
Pseudocode:
- Uses plain English to describe each step of the algorithm.
- Example pseudocode for checking if a number is even or odd:
START Input number If number MOD 2 == 0 Then Output "Even" Else Output "Odd" END
e. Test and Validate the Solution
- Testing: Ensures the solution meets all requirements under various conditions.
- Types of Testing:
- Unit Testing: Tests individual components of the solution.
- Integration Testing: Verifies that different components work together.
- System Testing: Validates the entire system’s functionality.
- Acceptance Testing: Ensures the solution meets end-user expectations.
- Validation: Confirms the solution’s correctness and efficiency.
Debugging Techniques:
- Breakpoints: Pause program execution to inspect variables.
- Error Logs: Analyze runtime errors for debugging.
- Testing Tools: Use software tools like JUnit for testing algorithms.
2. Program Design Principles
Effective program design ensures that software solutions are robust, efficient, and easy to maintain. Below are the core principles:
a. Modularity
- Break the program into smaller, manageable components (modules).
- Each module handles a specific task or functionality.
- Benefits:
- Easier debugging.
- Code reuse.
- Simplified collaboration among developers.
b. Maintainability
- Write clean, organized code with meaningful variable and function names.
- Include comments and documentation to explain complex logic.
- Example: Instead of writing:
int x = 1;
Use:
int userAge = 1; // Represents the user’s age
c. Scalability
- Design systems to handle growth in data volume, users, or functionality.
- Example: Implement a database that supports horizontal scaling to accommodate more users.
d. Efficiency
- Optimize both time and space complexity.
- Use efficient data structures (e.g., HashMaps for quick lookups).
- Write algorithms that minimize unnecessary computations.
e. User-Friendliness
- Prioritize intuitive design and user experience.
- Include error messages that guide users to resolve issues.
3. Role of Algorithms in Problem-Solving
Algorithms play a crucial role in IT problem-solving by providing a clear path to solutions.
a. Characteristics of a Good Algorithm
- Finiteness: Must terminate after a finite number of steps.
- Definiteness: Steps must be clear and unambiguous.
- Input/Output: Accepts input and produces output.
- Effectiveness: Uses basic operations that are executable.
b. Common Algorithms in IT
- Searching Algorithms:
- Linear Search: Sequentially checks each element.
- Binary Search: Divides the search space in half (requires sorted input).
- Sorting Algorithms:
- Bubble Sort: Repeatedly swaps adjacent elements if they are in the wrong order.
- Merge Sort: Divides the array into halves, sorts each half, and merges them.
c. Visualization of Algorithms
- Binary Search Flowchart:
[Start] --> [Is array sorted?] --> (No) --> [Sort Array] --> [Proceed with Binary Search] | (Yes) --> [Is Middle Element = Target?] | (Yes) --> [Output: Element Found] | (No) --> [Adjust Search Range]
- Pseudocode for Merge Sort:
START Function MergeSort(arr): If arr has one element or is empty: Return arr Else: Divide arr into two halves: left and right left = MergeSort(left) right = MergeSort(right) Return Merge(left, right) Function Merge(left, right): Create empty result array While left and right are not empty: Compare first elements of left and right Append smaller element to result array Append remaining elements of left and right to result array Return result END
4. Testing and Debugging
a. Levels of Testing
- Unit Testing: Ensures individual program units work correctly.
- Integration Testing: Verifies modules interact as expected.
- System Testing: Validates the overall system against requirements.
- Regression Testing: Ensures new updates don’t break existing functionality.
b. Debugging Techniques
- Print Statements: Output variable values to identify issues.
- Automated Tools: Use tools like IntelliJ IDEA or Eclipse.
- Version Control Systems: Track changes and roll back if necessary.
5. Real-World Applications of Problem-Solving
a. Web Development
- Identify and resolve issues with responsiveness, broken links, or server-side performance.
- Use algorithms for optimizing load time (e.g., image compression, lazy loading).
b. Data Analysis
- Employ sorting and filtering algorithms to process large datasets.
- Use visualization tools (e.g., Python’s Matplotlib) for insights.
c. Artificial Intelligence and Machine Learning
- Develop algorithms for data clustering, pattern recognition, and predictions.
d. Networking
- Use routing algorithms like Dijkstra’s Algorithm to find the shortest path in network communications.
Problem-Solving and Program Design
Problem-solving is a foundational skill in Information Technology (IT) that involves understanding, analyzing, and addressing complex issues systematically. In IT, problem-solving encompasses identifying the problem, breaking it into smaller, manageable tasks, and designing effective solutions. The divide-and-conquer approach and structured methodologies are essential tools for solving these problems efficiently.
Divide-and-Conquer Approach
The divide-and-conquer approach is a strategy where a large problem is broken down into smaller, independent tasks. These smaller tasks are solved individually, and their solutions are combined to address the original problem.
Steps in the Divide-and-Conquer Approach
- Divide: Break the problem into smaller sub-problems that are easier to solve.
- Conquer: Solve each sub-problem independently. This may involve recursion or iterative methods.
- Combine: Integrate the solutions of the sub-problems to solve the larger problem.
Benefits of the Divide-and-Conquer Approach
- Simplifies complex problems.
- Encourages modularity in design.
- Enhances debugging and testing processes.
- Promotes reuse of sub-solutions in other problems.
Examples of Divide-and-Conquer in IT
- Algorithm Design: Sorting algorithms such as Merge Sort and Quick Sort.
- System Development: Breaking down software projects into modules or components.
- Troubleshooting: Identifying the root cause of issues by isolating specific areas.
Structured Approach to Solving Complex Problems
The structured approach involves analyzing and solving problems methodically, ensuring clarity and efficiency throughout the process.
Steps in the Structured Approach
- Define the Problem: Clearly identify the problem, its scope, and constraints.
- Analyze the Problem: Break the problem into smaller parts and understand the relationships between them.
- Design the Solution:
- Develop algorithms or flowcharts to outline the solution.
- Use tools such as pseudocode to represent logical steps.
- Implement the Solution: Translate the design into code or a working system.
- Test the Solution: Verify that the solution works as expected and refine as necessary.
- Evaluate the Solution: Assess the effectiveness and efficiency of the solution.
Characteristics of a Structured Approach
- Logical and systematic.
- Focused on clarity and precision.
- Adaptable to different types of problems.
Key Elements of Problem-Solving in IT
Identifying the Problem
- Understand the problem statement.
- Identify inputs, processes, and expected outputs.
- Consider constraints and limitations.
Breaking Down the Problem
- Use tools like flowcharts and diagrams.
- Identify dependencies and interactions between components.
- Prioritize tasks based on complexity and importance.
Designing Algorithms
- Represent logical steps using pseudocode.
- Ensure algorithms are efficient and easy to follow.
- Example of pseudocode for calculating the sum of an array:
Initialize total as 0 For each number in the array: Add the number to total Output total
Flowcharts
- Use shapes to represent different types of actions:
- Oval: Start/End.
- Rectangle: Processes.
- Diamond: Decision points.
- Arrow: Flow of control.
- Example: A flowchart for determining if a number is odd or even.
Testing and Debugging
- Use test cases to evaluate the solution.
- Debug errors systematically by isolating problem areas.
- Perform both unit testing (individual components) and integration testing (combined system).
Applications in IT
Software Development
- Apply structured problem-solving to design and implement software systems.
- Use divide-and-conquer to create modular code.
Network Troubleshooting
- Isolate network issues by testing individual components (e.g., hardware, software, configuration).
Database Management
- Design efficient queries and database structures using structured methods.
- Optimize performance by breaking down complex operations into smaller tasks.
Cybersecurity
- Analyze threats systematically.
- Develop layered security protocols using modular approaches.
Illustrative Examples for Students
Scenario 1: Organizing a School Event
Problem: Plan a school event involving multiple activities. Divide-and-Conquer:
- Divide tasks: Venue booking, guest coordination, and activity planning.
- Conquer tasks independently by assigning teams.
- Combine results into a cohesive event plan.
Scenario 2: Writing a Computer Program
Problem: Create a program to calculate the average grade of students. Structured Approach:
- Define the problem: Inputs are grades; output is the average.
- Analyze: Identify the formula for the average.
- Design:
- Input grades.
- Sum grades.
- Divide sum by the number of grades.
- Implement in code.
- Test with sample data.
Scenario 3: Website Development
Problem: Design a website with a homepage, contact form, and gallery. Divide-and-Conquer:
- Divide: Separate tasks for homepage, contact form, and gallery.
- Conquer: Develop each section independently.
- Combine: Integrate sections into the website.
Tips for Mastering Problem-Solving in IT
- Practice Regularly: Solve a variety of problems to build familiarity and confidence.
- Document Your Process: Keep track of steps taken and insights gained.
- Collaborate: Work with peers to explore different perspectives.
- Leverage Technology: Use software tools to aid in design and implementation.
Conclusion
The divide-and-conquer approach and structured problem-solving are indispensable for tackling complex problems in IT. By breaking down problems, analyzing their components, and methodically implementing solutions, students can develop robust and efficient systems. With practice and dedication, these strategies can be applied across diverse areas in Information Technology, ensuring clarity, efficiency, and success.
Problem-Solving and Program Design in Information Technology
Introduction to Problem-Solving
Problem-solving in Information Technology (IT) is the process of identifying, analyzing, and resolving challenges using systematic approaches. It is a critical skill for IT professionals, as it lays the foundation for effective program design and the development of reliable software solutions.
Problem-solving involves several stages, each aimed at decomposing complex issues into manageable parts to identify practical solutions. By following structured methodologies, IT professionals ensure that the solutions they implement are efficient, scalable, and maintainable.
Key Concepts in Problem-Solving
1. Definition of a Problem
A problem is a situation that requires a solution to achieve a specific goal. In IT, problems often involve inefficiencies, errors, or unmet requirements in software, systems, or processes.
Effective problem-solving begins with a clear understanding of the problem. This involves:
- Identifying the problem’s scope.
- Determining the stakeholders involved.
- Understanding the goals and constraints.
2. Breaking Down the Problem
To solve a problem effectively, it is essential to decompose it into smaller, more manageable components. This decomposition allows IT professionals to focus on one aspect of the problem at a time, ensuring that each element is addressed systematically.
The primary components of problem decomposition include:
- Input: The data or information provided to the system.
- Process: The operations or actions performed on the input to achieve a desired outcome.
- Output: The result or product of the process.
A widely used tool for representing these components is the IPO Chart (Input-Process-Output Chart), which delineates the relationship between these elements.
3. Systematic Problem-Solving Approaches
Several systematic approaches are commonly used in IT problem-solving, including:
- Algorithm Development: Creating a step-by-step procedure for solving a problem.
- Flowcharting: Using diagrams to visualize the sequence of steps in a process.
- Pseudocode: Writing a simplified, code-like description of a program’s logic.
Steps in Problem-Solving
The problem-solving process in IT typically involves the following steps:
Step 1: Identify the Problem
- Clearly define the problem statement.
- Determine the root cause of the problem.
- Gather all relevant information from stakeholders and systems.
Step 2: Analyze the Problem
- Break down the problem into its significant components (input, process, and output).
- Examine the constraints and requirements.
- Use tools like cause-and-effect diagrams or flowcharts for better understanding.
Step 3: Design a Solution
- Brainstorm potential solutions and evaluate their feasibility.
- Develop algorithms or procedures that address the problem.
- Create an IPO Chart to map out the solution structure.
Step 4: Implement the Solution
- Translate the designed solution into code using appropriate programming languages.
- Test the implementation to ensure it works as intended.
- Debug and optimize the code for performance and reliability.
Step 5: Evaluate the Solution
- Assess whether the solution meets the problem’s requirements.
- Collect feedback from stakeholders.
- Make necessary adjustments or improvements.
Program Design Principles
Program design is the process of planning and creating software that solves specific problems or fulfills user needs. It emphasizes clarity, efficiency, and maintainability to ensure that the program meets its objectives.
1. Understanding the Problem
Before designing a program, it is essential to thoroughly understand the problem it aims to solve. This involves:
- Identifying the target audience.
- Understanding the program’s purpose and scope.
- Considering constraints such as time, budget, and resources.
2. Algorithm Development
Algorithms form the backbone of program design. An algorithm is a set of instructions that define how a problem is solved step-by-step. Effective algorithms should be:
- Accurate: They must produce the correct output for all valid inputs.
- Efficient: They should minimize resource usage (time and space).
- Readable: They should be easy to understand and modify.
3. Tools for Program Design
Several tools and techniques are used in program design, including:
- Flowcharts: Visual representations of processes, showing the sequence of steps using symbols such as rectangles (processes), diamonds (decisions), and arrows (flow direction).
- Pseudocode: A plain-language description of a program’s logic, bridging the gap between human understanding and machine code.
- Modular Design: Dividing the program into smaller, self-contained modules, each responsible for a specific task. This promotes reusability and simplifies debugging.
4. Data Structures and Algorithms
Selecting the right data structures and algorithms is crucial for efficient program design. Common data structures include:
- Arrays: For storing sequences of elements.
- Linked Lists: For dynamic memory allocation.
- Stacks and Queues: For managing data in specific orders.
- Trees and Graphs: For hierarchical and networked relationships.
5. Validation and Testing
Once the program is designed and implemented, it must be tested rigorously to ensure:
- It meets all functional requirements.
- It handles edge cases and invalid inputs gracefully.
- It performs efficiently under various conditions.
The Role of IPO Charts
IPO Charts (Input-Process-Output Charts) are essential tools for problem-solving and program design. They provide a structured way to represent the key components of a problem and its solution.
1. Components of an IPO Chart
- Input: The data required to solve the problem.
- Process: The steps or operations performed on the input to produce the desired outcome.
- Output: The result or product generated by the process.
2. Benefits of IPO Charts
- Simplifies complex problems by breaking them down into fundamental components.
- Enhances understanding of the relationship between inputs, processes, and outputs.
- Serves as a reference during the implementation phase.
3. Example IPO Chart
For a program that calculates the average of three numbers:

Common Challenges in Problem-Solving and Program Design
1. Understanding Requirements
Misinterpreting requirements can lead to incorrect solutions. It is vital to:
- Communicate effectively with stakeholders.
- Use techniques like user stories and requirement specifications.
2. Managing Complexity
Large problems can be overwhelming. Strategies to manage complexity include:
- Modular design.
- Iterative development.
- Use of abstraction and encapsulation.
3. Debugging and Testing
Errors in code can lead to unexpected behavior. Debugging tools and systematic testing approaches (unit testing, integration testing, etc.) are essential for identifying and fixing issues.
4. Optimizing Performance
Programs must be optimized for speed and resource usage. This requires:
- Selecting efficient algorithms.
- Avoiding redundant computations.
- Profiling code to identify bottlenecks.
Conclusion
Problem-solving and program design are foundational skills in Information Technology. By decomposing problems into significant components, IT professionals can create structured, efficient, and reliable solutions. The use of tools like IPO Charts, flowcharts, and pseudocode enhances clarity and facilitates the transition from problem analysis to program implementation. Through systematic approaches and continuous testing, IT professionals can ensure that their solutions meet user needs and perform optimally in diverse scenarios.
Variables and Constants
Distinguishing Between Variables and Constants
In computer programming, the concepts of variables and constants are fundamental. They serve as building blocks for storing and managing data within a program.
Let us explore each in detail:
What are Variables?
Variables are symbolic names or identifiers used to store data values in a program. The value stored in a variable can change during the execution of a program. Variables act as placeholders in memory where data is stored temporarily for use during computation or processing.
- Definition: A variable is an area of storage whose value can change during program execution.
- Characteristics:
- Variables are dynamic; their values can be updated as the program runs.
- Each variable has a specific data type (e.g., integer, string) that defines the kind of value it can store.
- Variables must be declared before use in some programming languages (e.g., C, Java).
- Example in Python:
x = 10 # Variable x is assigned the value 10 print(x) # Output: 10 x = 20 # Variable x is reassigned a new value print(x) # Output: 20
What are Constants?
Constants, on the other hand, are immutable values. Once assigned, the value of a constant cannot be changed during the program’s execution. Constants provide a reliable way to store values that remain the same throughout the program.
- Definition: A constant is a value that does not change during program execution.
- Characteristics:
- Constants are fixed and cannot be modified after their initial declaration.
- They are often used for values that are universally true within a program (e.g., mathematical constants like Pi).
- Example in Python:
PI = 3.14159 # PI is a constant print(PI) # Output: 3.14159
Note: By convention, constants are often written in uppercase letters to distinguish them from variables.
Key Differences Between Variables and Constants
Data Types
Data types define the kind of values a variable or constant can store. Each programming language provides a variety of data types, which can broadly be categorized as follows:
1. Integers
Integers are whole numbers, both positive and negative, including zero. They do not have decimal points.
- Example:
5, -42, 0
- Uses: Counting, indexing, and performing arithmetic operations.
- In Python:
age = 25 # age is an integer print(type(age)) # Output: <class 'int'>
2. Floating Point (Real Numbers)
Floating-point numbers represent real numbers that include decimal points. They can store fractional values.
- Example:
3.14, -0.001, 2.0
- Uses: Scientific calculations, measurements, and precise arithmetic.
- In Python:
pi = 3.14159 # pi is a floating-point number print(type(pi)) # Output: <class 'float'>
3. Characters
Characters represent individual letters, digits, or symbols. They are typically stored in single quotes in many programming languages.
- Example:
'A', '9', '@'
- Uses: Representing textual or symbolic information.
- In Python:
letter = 'A' # letter is a character print(type(letter)) # Output: <class 'str'>
Note: In Python, characters are stored as strings of length 1.
4. Boolean
Boolean data types represent truth values: True
or False
.
- Uses: Logical operations, decision-making, and conditional statements.
- In Python:
is_valid = True # is_valid is a boolean print(type(is_valid)) # Output: <class 'bool'>
5. String
Strings are sequences of characters used to represent text.
- Example:
"Hello", "123", "@!#"
- Uses: Displaying messages, storing names, and manipulating textual data.
- In Python:
name = "Alice" # name is a string print(type(name)) # Output: <class 'str'>
Importance of Variables and Constants in Programming
Variables
- Dynamic Storage: Variables allow programs to dynamically store and process data.
- Flexibility: Since variables can change, they enable versatile and interactive programs.
- Examples in Use:
- Storing user input.
- Tracking scores in a game.
- Managing intermediate results in calculations.
Constants
- Stability: Constants ensure certain values remain unchanged throughout execution, reducing errors.
- Readability: They make programs easier to read and understand by providing meaningful names to fixed values.
- Examples in Use:
- Representing mathematical constants like
PI
. - Defining configuration values (e.g., maximum retries).
- Specifying constant strings (e.g.,
"ERROR"
).
- Representing mathematical constants like
Common Mistakes and Best Practices
For Variables:
- Mistake: Using ambiguous variable names (e.g.,
x
,y
instead ofage
,score
). - Best Practice: Use descriptive names that indicate the purpose of the variable.
temperature = 98.6 # Good practice t = 98.6 # Poor practice
- Mistake: Forgetting to initialize variables before use.
- Best Practice: Always initialize variables to avoid undefined behavior.
count = 0 # Initialize before using
For Constants:
- Mistake: Accidentally modifying constants in code.
- Best Practice: Use naming conventions (e.g., uppercase) to indicate constants.
- Mistake: Hardcoding values instead of using constants.
- Best Practice: Define constants to avoid repetitive code.
DISCOUNT_RATE = 0.10 # Define constant price = 100 - (100 * DISCOUNT_RATE)
Conclusion
Understanding variables and constants is essential for effective programming. Variables provide the flexibility to work with changing data, while constants offer stability for fixed values. Choosing the right data type and following best practices ensures robust and efficient code. As you continue learning programming, keep exploring how these concepts are implemented in different languages and applied in real-world scenarios.
Algorithms
Definition of an Algorithm
An algorithm is a step-by-step procedure or set of rules designed to perform a specific task or solve a particular problem. It is a sequence of instructions that can be executed systematically to achieve the desired output from a given input. Algorithms serve as the foundation of all programming and computational tasks.
Characteristics of Algorithms:
- Finite Number of Steps: An algorithm must terminate after a limited number of steps. It cannot run indefinitely and must resolve the problem within a reasonable timeframe.
- Precise and Unambiguous: Every step of the algorithm must be clear and unambiguous, leaving no room for interpretation or confusion.
- Flow of Control: The instructions in an algorithm must have a clear sequence, ensuring a logical progression from one process to another.
- Definiteness: Each step in the algorithm must be well-defined and produce a specific outcome or result.
- Input and Output: An algorithm takes one or more inputs and produces at least one output as a result of its execution.
- Effectiveness: The steps should be simple enough to be performed within a finite amount of time, using basic computational resources.
The Importance of Algorithms in Problem-Solving
Algorithms play a crucial role in information technology and software development. They provide a systematic approach to problem-solving, allowing complex tasks to be broken down into manageable steps. Properly designed algorithms ensure efficiency, accuracy, and scalability of solutions.
Stages in Problem-Solving
Problem-solving involves several structured stages to develop an effective solution. These stages include:
Problem Identification:
- Understand and define the problem clearly.
- Identify the key requirements and constraints.
- Determine the desired outcome or objective.
Analysis:
- Break the problem into smaller, manageable components.
- Identify the inputs, processes, and expected outputs.
- Determine any potential challenges or limitations.
Algorithm Development:
- Create a step-by-step plan to solve the problem.
- Ensure the algorithm is logical, unambiguous, and efficient.
- Include alternative solutions or contingency plans, if applicable.
Implementation:
- Translate the algorithm into a programming language.
- Write code to execute the algorithm on a computer.
- Test the implementation for correctness and reliability.
Verification and Validation:
- Verify that the solution meets the specified requirements.
- Validate that the solution works correctly for all intended inputs.
- Debug and refine the algorithm as necessary.
Documentation and Maintenance:
- Document the algorithm and code for future reference.
- Update and maintain the solution as requirements change.
Types of Algorithms
Algorithms can be classified based on their approach or the type of problem they address. Some common types include:
Sorting Algorithms:
- Used to arrange data in a specific order (ascending or descending).
- Examples: Bubble Sort, Quick Sort, Merge Sort, Selection Sort.
Searching Algorithms:
- Used to find specific data within a dataset.
- Examples: Linear Search, Binary Search.
Divide and Conquer Algorithms:
- Break the problem into smaller sub-problems, solve them individually, and combine the results.
- Examples: Merge Sort, Quick Sort.
Greedy Algorithms:
- Make the most optimal choice at each step to achieve the global solution.
- Examples: Dijkstra’s Algorithm, Kruskal’s Algorithm.
Dynamic Programming:
- Solve problems by breaking them down into overlapping sub-problems and using previously computed results.
- Examples: Fibonacci Sequence, Knapsack Problem.
Backtracking Algorithms:
- Explore all possible solutions by trying one solution at a time and backtracking when a solution fails.
- Examples: N-Queens Problem, Maze Solving.
Recursive Algorithms:
- Solve a problem by solving smaller instances of the same problem recursively.
- Examples: Factorial Calculation, Tower of Hanoi.
Brute Force Algorithms:
- Explore all possible solutions to find the best one.
- Often inefficient for large datasets but guarantees correctness.
Tools for Algorithm Design
Several tools and techniques are used to design and represent algorithms effectively. These include:
Flowcharts:
- Graphical representations of an algorithm using symbols to depict processes, decisions, and flow of control.
Pseudocode:
- A textual representation of an algorithm using a structured, plain-language format that resembles programming syntax.
Decision Tables:
- Tabular representations of decision-making processes within an algorithm, showing conditions and corresponding actions.
Structured English:
- A combination of natural language and structured syntax to describe algorithms in a human-readable format.
Diagrams:
- Visual tools such as entity-relationship diagrams (ERDs) or Unified Modeling Language (UML) diagrams to represent system components and interactions.
Characteristics of a Good Algorithm
A well-designed algorithm should:
- Be correct and produce the expected output for all valid inputs.
- Be efficient, minimizing computational resources (time and space).
- Be easy to understand and implement.
- Handle edge cases and unexpected inputs gracefully.
- Be scalable, accommodating larger or more complex datasets without significant performance degradation.
Example Algorithms
Simple Algorithm for Adding Two Numbers:
- Input: Two numbers, A and B.
- Process: Add A and B.
- Output: Display the result.
Pseudocode:
Start Input A, B Sum = A + B Output Sum End
Algorithm to Find the Largest Number in an Array:
- Input: Array of numbers.
- Process: Iterate through the array and compare each element to find the largest.
- Output: Display the largest number.
Pseudocode:
Start Input Array Max = Array[0] For each number in Array: If number > Max: Max = number Output Max End
Real-World Applications of Algorithms
- Search Engines: Algorithms like PageRank and crawling algorithms help retrieve relevant web pages based on user queries.
- E-Commerce: Recommendation algorithms suggest products based on user behavior and preferences.
- Cryptography: Algorithms ensure secure communication through encryption and decryption.
- Navigation Systems: Algorithms like Dijkstra’s or A* find the shortest path between locations.
- Data Compression: Algorithms reduce file sizes for efficient storage and transmission (e.g., JPEG, MP3).
Common Pitfalls in Algorithm Design
- Ambiguity: Failing to define steps clearly leads to misinterpretation.
- Inefficiency: Poorly optimized algorithms waste time and resources.
- Edge Cases: Ignoring special or unexpected inputs can lead to errors.
- Overcomplexity: Unnecessarily complicated algorithms are harder to implement and maintain.
Summary
Understanding and designing algorithms is a fundamental skill in information technology and programming. By mastering the principles of algorithms, you can develop efficient and reliable solutions to a wide range of problems, paving the way for innovative and impactful applications in technology and beyond.
Problem-Solving and Program Design
Problem-solving and program design are foundational skills in information technology and computer science. These skills enable individuals to design effective solutions to computational problems, often expressed as algorithms, flowcharts, or pseudocode. By mastering these techniques, developers can build reliable, efficient, and user-friendly software systems.
1. Representing Algorithms in Flowcharts and Pseudocode
Flowchart Representation
A flowchart is a graphical representation of a process or algorithm. It uses standard symbols to represent various types of operations and the flow of control within the algorithm. Flowcharts make it easier to visualize the logic and structure of a program before writing code.
Key Flowchart Symbols
Input/Output Symbol (Parallelogram): Represents operations involving input (e.g., reading data) or output (e.g., displaying results).
- Example: “Input user’s age” or “Display the sum.”
Process Symbol (Rectangle): Represents a process or an operation that needs to be performed.
- Example: “Calculate the total” or “Store the result in a variable.”
Decision Symbol (Diamond): Represents a decision-making step where a condition is checked, and the flow branches based on the result.
- Example: “Is X greater than Y?”
Directional Arrows: Indicate the flow of control from one step to another.
- Arrows connect the symbols to show the sequence of operations.
Start/Stop Symbol (Oval): Represents the beginning or end of a process.
- Example: “Start the program” or “Stop the program.”
Advantages of Flowcharts
- Simplifies complex processes.
- Enhances understanding of algorithms.
- Provides a clear visual representation for debugging and analysis.
Pseudocode Representation
Pseudocode is a textual representation of an algorithm written in a structured but plain language that resembles programming. It focuses on the logic rather than syntax, making it language-independent.
Key Elements of Pseudocode
Input/Output:
Input
orRead
: Indicates data to be entered into the system.- Example:
Input Age
- Example:
Output
,Display
, orPrint
: Represents data to be displayed or printed.- Example:
Print "Total is:" Total
- Example:
Processes:
- Operations like calculations, storing values, or modifying variables.
- Example:
Sum = A + B
- Example:
- Operations like calculations, storing values, or modifying variables.
Conditional Branching:
If-Then
: Executes a block of statements if a condition is true.- Example:
If Score > 50 Then Print "Pass" End If
- Example:
If-Then-Else
: Provides alternate execution paths based on a condition.- Example:
If Age >= 18 Then Print "Adult" Else Print "Minor" End If
- Example:
- Nested Conditions: Conditions within conditions for complex logic.
Loops:
- Used to repeat a block of statements.
- For Loop: Iterates a specific number of times.
For i = 1 to 10 Print i End For
- While Loop: Repeats as long as a condition is true.
While Count < 5 Print Count Count = Count + 1 End While
- Repeat Until Loop: Repeats until a condition becomes true.
Repeat Input Number Until Number > 0
- For Loop: Iterates a specific number of times.
- Used to repeat a block of statements.
2. Relational Operators
Relational operators compare two values and determine the relationship between them. They are commonly used in decision-making and control structures.
- Less than (
<
): True if the left operand is smaller than the right. - Greater than (
>
): True if the left operand is larger than the right. - Equal to (
=
): True if both operands are equal. - Less than or equal to (
<=
): True if the left operand is smaller or equal to the right. - Greater than or equal to (
>=
): True if the left operand is larger or equal to the right. - Not equal to (
<>
): True if the operands are not equal.
Examples:
If Marks >= 50 Then Print "Pass"
If A <> B Then Print "Values are different"
3. Logical Operators
Logical operators are used to combine or modify conditions in decision-making. They play a critical role in building complex logical expressions.
Types of Logical Operators
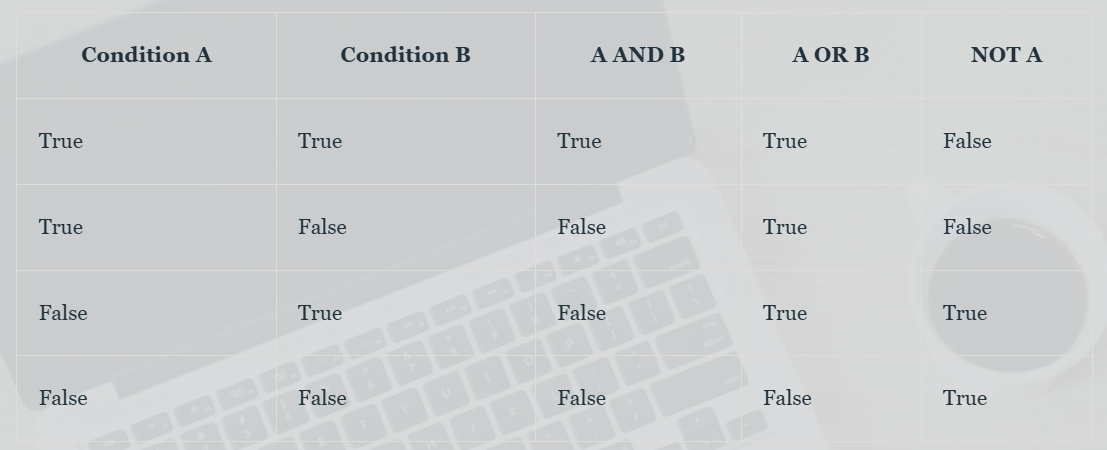
AND:
- True if both conditions are true.
- Example:
If Age >= 18 AND Citizenship = "Yes" Then Print "Eligible to vote" End If
OR:
- True if at least one condition is true.
- Example:
If Temperature < 0 OR Weather = "Snowing" Then Print "Wear a coat" End If
NOT:
- Negates the condition, making true conditions false and vice versa.
- Example:
If NOT (IsRaining) Then Print "Go for a walk" End If
Truth Tables
Truth tables are used to represent the outcome of logical operations for all possible input values.
4. Arithmetic Operators
Arithmetic operators perform basic mathematical operations.
Types of Arithmetic Operators
- Addition (
+
): Adds two numbers.- Example:
Sum = A + B
- Example:
- Subtraction (
-
): Subtracts one number from another.- Example:
Difference = A - B
- Example:
- Multiplication (
*
): Multiplies two numbers.- Example:
Product = A * B
- Example:
- Division (
/
): Divides one number by another.- Example:
Quotient = A / B
- Example:
- Modulus (
MOD
): Returns the remainder of a division operation.- Example:
Remainder = A MOD B
- Example:
- Integer Division (
DIV
): Returns the integer part of a division operation.- Example:
Result = A DIV B
- Example:
5. Applications of Problem-Solving Techniques
Step-by-Step Approach to Problem-Solving
- Define the Problem: Clearly state the problem to be solved.
- Analyze Requirements: Identify inputs, outputs, and processing requirements.
- Design the Algorithm: Develop the logical steps using flowcharts or pseudocode.
- Implement the Solution: Convert the design into actual code.
- Test and Debug: Verify that the solution works as expected and fix errors.
Practical Example
Problem: Calculate the sum of all even numbers from 1 to N.
Solution (Pseudocode):
Input N
Sum = 0
For i = 1 to N
If i MOD 2 = 0 Then
Sum = Sum + i
End If
End For
Print "Sum of even numbers is:" Sum
Solution (Flowchart):
- Start
- Input N
- Initialize Sum to 0
- Loop from 1 to N
- Check if the number is even (i MOD 2 = 0)
- If True, add it to Sum
- End Loop
- Output the Sum
- Stop
Conclusion
Mastering the techniques of algorithm representation, logical reasoning, and arithmetic computation is essential for efficient problem-solving in programming. Flowcharts provide a clear visual guide, while pseudocode offers a structured textual plan for implementation. By combining these tools with relational and logical operators, developers can address complex problems systematically.
Testing Algorithms for Correctness
Testing algorithms for correctness ensures that they produce the expected outputs for given inputs. This process is crucial in the development and maintenance of software systems and involves systematically verifying that an algorithm functions as intended in all scenarios.
Below are key concepts and techniques used in testing algorithms:
1. Importance of Testing Algorithms
- Error Detection: Identifies logical, syntax, or runtime errors in the algorithm.
- Validation: Confirms that the algorithm meets the specified requirements and objectives.
- Optimization: Helps refine the algorithm to improve performance and efficiency.
- Reliability: Ensures consistent and predictable behavior of the algorithm under various conditions.
2. Techniques for Testing Algorithms
a. Dry Runs
A dry run involves manually simulating the execution of an algorithm using pen and paper to understand its behavior. It helps to:
- Identify logical errors without using a computer.
- Ensure clarity in the algorithm’s logic.
b. Desk Checks
Desk checks involve the use of trace tables to monitor the values of variables during each step of the algorithm’s execution. This technique provides insight into:
- The flow of control through the algorithm.
- Intermediate values and how they contribute to the final output.
c. Debugging
Debugging is a systematic process of locating and fixing errors in the algorithm. Common debugging tools include:
- Print Statements: To display the values of variables during execution.
- Debugging Software: Tools integrated into programming environments that allow step-by-step execution.
d. Test Cases
Developing test cases ensures that the algorithm is tested under various conditions. Test cases can be:
- Normal Test Cases: With typical inputs that the algorithm is expected to handle.
- Boundary Test Cases: To test the algorithm’s behavior at the limits of its input range.
- Invalid Test Cases: With erroneous inputs to check the robustness of error handling.
e. Unit Testing
This involves testing individual components or functions of the algorithm in isolation to ensure their correctness.
f. Integration Testing
After testing individual components, integration testing ensures that all parts of the algorithm work together seamlessly.
3. Steps in Testing an Algorithm
- Step 1: Understand the Problem: Define the problem the algorithm aims to solve.
- Step 2: Develop Test Cases: Identify input-output pairs for validation.
- Step 3: Execute the Algorithm: Perform a dry run or use a programming language.
- Step 4: Compare Outputs: Match the actual output with the expected output.
- Step 5: Refine the Algorithm: Debug and improve the algorithm as needed.
4. Common Errors in Algorithms
- Syntax Errors: Mistakes in the code that prevent execution.
- Logical Errors: Errors in the logic that produce incorrect results.
- Runtime Errors: Errors that occur during execution, such as division by zero.
- Semantic Errors: Misinterpretation of the problem requirements.
Desk Checks/Dry Runs
A desk check or dry run is a manual process of verifying an algorithm’s correctness. It involves simulating the algorithm step-by-step to trace the flow of data and logic. Below are detailed notes on desk checks and trace tables:
1. Desk Checks Desk checks are performed without executing the algorithm on a computer. They are particularly useful in:
- Understanding how the algorithm processes data.
- Identifying errors in the logic or design of the algorithm.
- Gaining insights into the algorithm’s behavior before implementation.
2. Trace Tables Trace tables are a tool used during desk checks to monitor the state of variables at each step of the algorithm.
They are constructed as follows:
a. Components of a Trace Table
- Column Headings: Represent variable names or identifiers.
- Rows: Represent the values of variables during each step or iteration.
- Additional Columns: May include conditions for decision-making (e.g., results of Boolean expressions).
b. Purpose of Trace Tables
- Provide a clear view of the algorithm’s flow.
- Identify points where errors or unexpected behaviors occur.
- Verify the correctness of loops, conditionals, and calculations.
c. Example of a Trace Table For the following algorithm:
Initialize sum = 0
For i = 1 to 5
sum = sum + i
End For
Output sum
The trace table would look like this:
At the end of the algorithm, the value of sum
is 15, which is output as the result.
d. Steps to Construct and Use a Trace Table
- Step 1: Identify Variables: List all variables and their initial values.
- Step 2: Add Columns for Variables: Create a column for each variable and conditions if applicable.
- Step 3: Trace Each Step: Record the values of variables for each step or iteration.
- Step 4: Analyze the Table: Verify that the outputs match the expected results.
3. Benefits of Desk Checks and Trace Tables
- Provide a systematic way to understand and debug algorithms.
- Enhance problem-solving skills by simulating the execution flow.
- Save time and resources by identifying errors before coding.
4. Common Scenarios for Desk Checks
- Algorithms with loops and iterations.
- Complex conditional statements and decision-making processes.
- Algorithms involving mathematical computations.
- Verifying edge cases or boundary conditions.
5. Limitations of Desk Checks
- Time-consuming for complex algorithms with numerous variables.
- Prone to human error, especially in large trace tables.
- Not a substitute for actual implementation and testing on a computer.
6. Best Practices for Desk Checks
- Use small, manageable test cases to reduce complexity.
- Double-check calculations and logic at each step.
- Collaborate with peers to identify errors and refine the algorithm.
7. Tools to Assist Desk Checks While desk checks are typically manual, some tools can assist in creating and managing trace tables, such as spreadsheet software (e.g., Microsoft Excel, Google Sheets).
Conclusion
Testing algorithms for correctness and performing desk checks with trace tables are foundational techniques in problem-solving and program design. They not only ensure that algorithms function as intended but also enhance understanding of the underlying logic and flow. By mastering these techniques, students and professionals can develop more reliable, efficient, and effective algorithms.
Section Eight: PROGRAM IMPLEMENTATION
Low-Level and High-Level Programming Languages
Programming Languages
A programming language is a formal set of instructions that a computer can understand and execute. These languages allow programmers to write software, control hardware, and develop applications by defining algorithms and manipulating data. Programming languages are broadly categorized into low-level and high-level languages based on their abstraction level and proximity to machine code.
Low-Level Programming Languages
Definition
Low-level programming languages operate close to the hardware and provide minimal abstraction from the machine’s instruction set architecture. They directly interact with a computer’s central processing unit (CPU) and memory, making them highly efficient but challenging for humans to read and write.
Types of Low-Level Languages
- Machine Language (First-Generation Language)
- Description: Machine language consists of binary code (0s and 1s) that the computer’s CPU directly understands. It is the most basic form of programming and represents the hardware instructions.
- Features:
- Written in binary or hexadecimal.
- CPU-specific and not portable across different hardware architectures.
- Extremely fast and efficient as it executes without translation.
- Examples:
- Binary code:
10101011 00001111
- Binary code:
- Advantages:
- Maximum control over hardware.
- Fastest execution speed since no translation is needed.
- Disadvantages:
- Difficult to write, debug, and maintain.
- Tedious and error-prone.
- Assembly Language (Second-Generation Language)
- Description: Assembly language uses mnemonic codes to represent machine instructions. It provides a symbolic representation of the machine code, making it slightly easier for humans to understand.
- Features:
- Requires an assembler to convert into machine code.
- Still CPU-specific and non-portable.
- Provides direct access to hardware and system resources.
- Examples:
MOV AL, 1
(moves the value 1 into the AL register).
- Advantages:
- Easier to understand than binary.
- High performance and control over hardware resources.
- Disadvantages:
- Still complex and not suitable for large-scale applications.
- Limited abstraction makes it hard to debug.
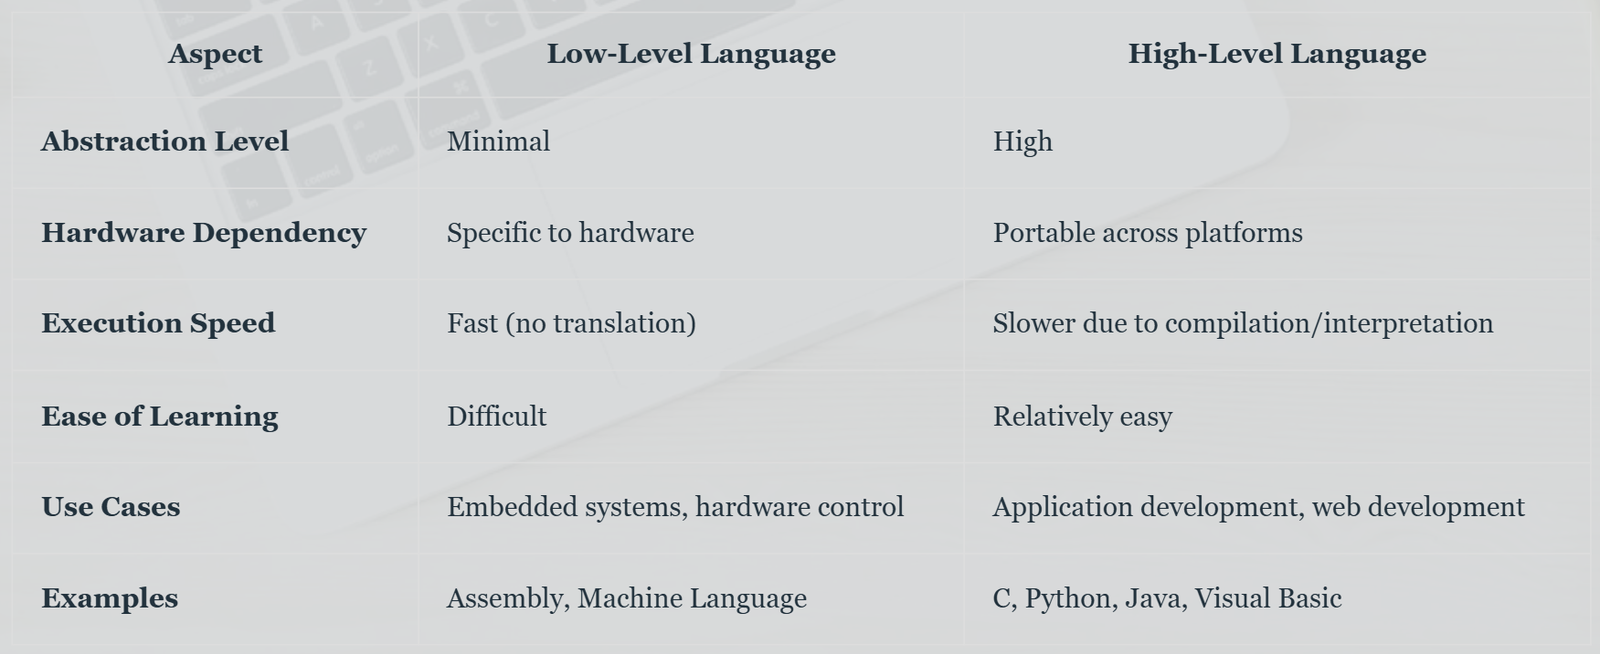
Characteristics of Low-Level Languages
- Minimal Abstraction: These languages closely reflect the hardware’s functionality.
- Hardware-Specific: Programs are tailored for specific processors or hardware.
- Efficient Execution: Programs execute quickly due to the lack of translation overhead.
- Complexity: They are difficult to learn, write, and maintain, requiring knowledge of computer architecture.
High-Level Programming Languages
Definition
High-level programming languages provide greater abstraction from the hardware, allowing programmers to focus on logic and functionality rather than intricate hardware details. These languages are designed to be human-readable and portable across different systems.
Features of High-Level Languages
- Use of English-like Syntax: Commands and statements are similar to natural language (e.g.,
if
,for
,while
). - Portability: Code written in high-level languages can be executed on multiple platforms with minimal modifications.
- Ease of Debugging: Tools like debuggers and compilers simplify error detection.
- Abstraction: Complex operations are encapsulated into simple commands or functions.
Types of High-Level Languages
Procedural Languages
- Focus on step-by-step instructions to achieve a task.
- Example: C, Pascal.
Object-Oriented Languages
- Use objects and classes to organize code and data.
- Example: Java, C++, Python.
Functional Languages
- Focus on mathematical functions and immutability.
- Example: Haskell, Lisp.
Scripting Languages
- Used for automating tasks and managing applications.
- Example: Python, JavaScript.
Markup Languages
- Primarily used for data formatting and presentation.
- Example: HTML, XML.
Examples of High-Level Languages
- Visual Basic:
- A beginner-friendly language used for developing Windows applications.
- Pascal:
- Used for teaching structured programming.
- C:
- Combines the efficiency of low-level programming with high-level syntax.
Advantages of High-Level Languages
- Ease of Use: Readable and intuitive syntax makes programming accessible.
- Error Reduction: High-level languages have built-in error checking and debugging tools.
- Productivity: Programmers can write complex applications quickly.
- Portability: Programs can run on different hardware and operating systems with minimal changes.
Disadvantages of High-Level Languages
- Performance Overhead: Programs are slower than those written in low-level languages due to translation layers (e.g., compilers, interpreters).
- Limited Control: Developers cannot directly manipulate hardware or system resources.
Comparing Low-Level and High-Level Languages
Role of Translators in Programming
High-level programs need to be translated into machine code for execution. Translators are tools that perform this task.
Types of Translators
Compilers
- Convert entire source code into machine code before execution.
- Example: GCC for C/C++.
Interpreters
- Translate and execute code line-by-line.
- Example: Python Interpreter.
Assemblers
- Convert assembly language into machine code.
- Example: MASM (Microsoft Macro Assembler).
Factors to Consider When Choosing a Language
- Performance Needs: Low-level languages are preferable for performance-critical tasks.
- Portability: High-level languages are ideal for cross-platform compatibility.
- Project Complexity: High-level languages simplify development for complex applications.
- Developer Expertise: Low-level programming requires a deep understanding of hardware.
Applications of Low-Level and High-Level Languages
Low-Level Languages
- Writing device drivers.
- Programming embedded systems (e.g., microcontrollers, IoT devices).
- Game engine optimization.
High-Level Languages
- Web and mobile application development.
- Scientific computing and data analysis.
- Enterprise software and database systems.
Future of Programming Languages
Advances in technology have blurred the lines between low-level and high-level languages. Modern tools and compilers optimize high-level code to achieve performance close to low-level programming. Additionally, new paradigms like quantum programming and artificial intelligence influence the evolution of programming languages.
Steps in Program Implementation and Maintenance in Software Development
Program Implementation
Program implementation refers to the series of steps involved in creating, translating, executing, and maintaining a software program. This process ensures that the program functions as intended and meets the requirements of its users. The steps involved are foundational to software development and are widely taught in Information Technology syllabi. These steps include creating source code, translating and linking it, executing or running the program, and maintaining it over time. Each step requires careful planning, execution, and monitoring to ensure success.
Step 1: Create Source Code
Source code is the human-readable set of instructions written in a programming language to define the program’s behavior and functionality. The creation of source code involves multiple sub steps:
1. Understanding the Problem
Before writing code, a clear understanding of the problem is essential. This involves:
- Problem Analysis: Defining the problem and determining its scope.
- Requirements Gathering: Identifying the program’s functional and non-functional requirements.
- Design Specifications: Developing a blueprint that outlines the program’s structure and flow.
2. Selecting a Programming Language
Choosing an appropriate programming language depends on factors such as:
- The program’s purpose (e.g., web development, mobile apps, data analysis).
- The target platform (e.g., Windows, macOS, Android).
- Developer expertise. Examples include Python, Java, C++, and JavaScript.
3. Writing the Code
- Syntax and Semantics: Ensuring the code adheres to the syntax rules of the chosen language.
- Code Structure: Using modular programming techniques like functions, classes, and methods.
- Best Practices: Writing readable, maintainable, and efficient code. This includes using meaningful variable names, comments, and adhering to coding standards.
4. Debugging During Development
- Syntax Errors: Correcting typos and mistakes in code structure.
- Logical Errors: Fixing errors in the program’s logic.
- Runtime Errors: Handling unexpected behaviors when the program runs.
5. Version Control
Using tools like Git to manage changes in source code and collaborate with other developers.
Step 2: Translate and/or Link
Translation and linking are crucial processes that convert human-readable source code into machine-executable code.
1. Translation
Translation involves converting source code into an intermediate or executable format. There are two main approaches:
Compilation:
- The entire program is translated into machine code before execution.
- Common in languages like C, C++, and Java.
- Produces an executable file (.exe, .bin).
Interpretation:
- Code is translated line-by-line during execution.
- Common in scripting languages like Python and JavaScript.
- Does not produce an independent executable file.
Hybrid Approach:
- Combines both methods. For instance, Java uses a compiler to create bytecode and an interpreter (JVM) to execute it.
2. Linking
Linking combines multiple object files or libraries into a single executable program. This process can include:
- Static Linking: Embedding all required libraries directly into the executable.
- Dynamic Linking: Referencing libraries at runtime, reducing executable size.
3. Tools Used
- Compilers: GCC, Clang, javac.
- Interpreters: Python interpreter, Node.js.
- Linkers: ld (Linux linker), Microsoft’s Link.exe.
4. Error Handling During Translation
- Compilation Errors: Issues like undeclared variables or type mismatches.
- Linker Errors: Missing or incompatible libraries.
Step 3: Execute/Run Program
The execution step involves running the program to produce the desired output.
1. Testing the Program
Before full deployment, the program must be tested to ensure it functions correctly:
- Unit Testing: Verifying individual components or modules.
- Integration Testing: Checking how modules interact.
- System Testing: Validating the entire program against requirements.
- User Acceptance Testing (UAT): Ensuring the program meets user needs.
2. Execution Environment
Programs can be executed in various environments depending on their design:
- Local Execution: Running the program on a developer’s machine.
- Server Execution: Hosting the program on a server for remote access.
- Cloud Platforms: Using cloud services like AWS, Azure, or Google Cloud.
3. Runtime Considerations
- Performance: Monitoring resource usage such as CPU, memory, and storage.
- Error Handling: Managing runtime errors to prevent crashes.
- Security: Ensuring the program does not expose sensitive data or allow unauthorized access.
Step 4: Maintain Program
Program maintenance involves updating, optimizing, and ensuring the program remains functional over time. This step is critical for long-term usability.
1. Types of Maintenance
- Corrective Maintenance: Fixing bugs and errors reported by users.
- Adaptive Maintenance: Modifying the program to work with changes in the environment (e.g., OS updates, new hardware).
- Perfective Maintenance: Enhancing performance, usability, or adding new features.
- Preventive Maintenance: Proactively identifying and addressing potential issues.
2. Tools and Techniques
- Bug Tracking Systems: Tools like JIRA, Bugzilla, and Trello for managing reported issues.
- Automated Testing: Using tools like Selenium or JUnit to test changes efficiently.
- Monitoring Tools: Solutions like New Relic or Datadog to track program performance and detect anomalies.
3. Challenges in Maintenance
- Legacy Code: Working with outdated or poorly documented code.
- Dependency Management: Ensuring compatibility with updated libraries or frameworks.
- Resource Allocation: Balancing maintenance efforts with the development of new features.
4. Importance of User Feedback
Gathering feedback from users helps identify areas for improvement and ensures the program evolves to meet their needs.
General Notes on Program Implementation
Key Principles
- Modular Design: Break the program into smaller, manageable components to simplify development and maintenance.
- Documentation: Maintain comprehensive documentation for each stage, including code comments, design specs, and user manuals.
- Iterative Development: Use agile methodologies to incrementally develop and refine the program.
- Quality Assurance: Implement strict testing protocols to ensure the program meets high standards.
- Scalability: Design the program to handle increased usage or data over time.
Common Challenges
- Time Constraints: Balancing deadlines with the need for thorough testing.
- Resource Limitations: Managing limited hardware, software, or personnel resources.
- Complexity: Dealing with intricate program logic or large datasets.
Emerging Trends
- DevOps: Integrating development and operations for faster, more reliable program deployment.
- Artificial Intelligence: Leveraging AI to automate code generation, debugging, and testing.
- Cloud Computing: Using cloud-based environments for program execution and maintenance.
- Continuous Integration/Continuous Deployment (CI/CD): Streamlining the transition from development to production.
Ethical Considerations
- Ensuring programs are accessible to all users, including those with disabilities.
- Avoiding biases in program algorithms.
- Protecting user privacy and data security.
Conclusion
Program implementation is a structured process that transforms an idea into a functional software product. By following the outlined steps—creating source code, translating and linking, executing, and maintaining—developers can produce reliable and efficient programs. Continuous learning, adaptation to new technologies, and adherence to best practices are essential for success in this dynamic field.
Errors in Programming
Errors in programming refer to problems in the code that prevent it from functioning as expected. These errors are categorized into three main types: syntax errors, logic errors, and runtime errors. Understanding these errors is critical for program implementation and debugging.
Syntax Errors
- Definition: Syntax errors occur when the code violates the grammatical rules of the programming language. These are detected by the compiler or interpreter before the program runs.
- Examples:
- Missing semicolon in C++ or Java.
- Incorrect indentation in Python.
- Using undefined variables or functions.
- Consequences: The program cannot execute until these errors are fixed.
- Common Causes:
- Misspelled keywords (e.g.,
pritn
instead ofprint
). - Missing brackets, parentheses, or quotation marks.
- Incorrect use of operators (e.g.,
=
instead of==
).
- Misspelled keywords (e.g.,
- Prevention:
- Use an Integrated Development Environment (IDE) with syntax highlighting and error detection.
- Frequently compile or run small sections of code to catch errors early.
Logic Errors
- Definition: Logic errors occur when the program runs without crashing but produces incorrect or unexpected results. These errors are not detected by the compiler or interpreter.
- Examples:
- Using the wrong formula in a calculation.
- Incorrect loop conditions causing infinite loops or skipped iterations.
- Misplacing conditional statements.
- Consequences: The program’s output is unreliable and does not meet the intended objectives.
- Common Causes:
- Flawed algorithms or design logic.
- Misunderstanding of the program’s requirements.
- Improper handling of edge cases.
- Detection and Fixing:
- Thoroughly test the program with a variety of inputs.
- Debugging tools to step through code execution and inspect variable values.
Runtime Errors
- Definition: Runtime errors occur while the program is executing. These typically result from operations that the system cannot handle during runtime.
- Examples:
- Division by zero.
- Accessing invalid array indices.
- File not found errors when attempting to read or write to a file.
- Consequences: Runtime errors cause the program to crash or terminate unexpectedly.
- Common Causes:
- Invalid user inputs (e.g., entering a letter instead of a number).
- Resource limitations (e.g., insufficient memory).
- Incorrect handling of exceptions.
- Prevention:
- Implement input validation to ensure user-provided data is correct.
- Use exception handling mechanisms to manage unexpected scenarios.
- Conduct stress testing to evaluate program behavior under extreme conditions.
Testing and Test Data
Testing is an essential phase in program implementation that ensures the software meets the desired requirements and functions correctly under various conditions. Effective testing involves using a range of test data.
Purpose of Testing
- Verification: Ensures the program performs as intended.
- Validation: Confirms the program meets user needs and requirements.
- Error Detection: Identifies and eliminates bugs in the code.
- Reliability Assessment: Determines if the program functions consistently across multiple runs.
- Performance Evaluation: Assesses the speed and efficiency of the program.
Types of Testing
- Unit Testing:
- Tests individual components or modules of the program in isolation.
- Helps detect errors early in the development process.
- Integration Testing:
- Examines how different modules work together.
- Ensures data is passed and processed correctly between components.
- System Testing:
- Evaluates the entire system as a whole.
- Tests for compliance with functional and non-functional requirements.
- Acceptance Testing:
- Determines whether the program satisfies user requirements.
- Conducted by end-users or clients.
- Regression Testing:
- Ensures that new changes or updates do not negatively impact existing functionality.
- Stress Testing:
- Evaluates program performance under extreme conditions, such as high user loads or limited system resources.
Types of Test Data
Test data is used to evaluate how well the program handles various inputs and scenarios. It is categorized into:
- Normal Data:
- Represents typical, valid inputs that the program is expected to process correctly.
- Example: A banking application receives a withdrawal amount within the account balance.
- Boundary Data:
- Tests the limits of acceptable input ranges.
- Example: Entering 0 or the maximum allowed value for an input field.
- Erroneous Data:
- Consists of invalid or unexpected inputs.
- Example: Entering text instead of numbers in a numerical field.
- Extreme Data:
- Represents inputs at the edge of the input domain, often larger or smaller than typical inputs.
- Example: Testing with very large files or high transaction volumes.
Testing Process
- Plan the Test:
- Define test objectives and success criteria.
- Identify test cases and corresponding test data.
- Execute the Test:
- Run the program with the test data.
- Record the results for each test case.
- Analyze Results:
- Compare actual results with expected outcomes.
- Identify discrepancies and their root causes.
- Fix Issues:
- Modify the code to correct errors.
- Retest to ensure the issue is resolved without introducing new errors.
Debugging Techniques
Debugging is the process of identifying, analyzing, and fixing errors in a program. Effective debugging minimizes the time spent resolving issues and ensures the program functions as intended.
Common Debugging Techniques
- Code Review:
- Manually examine the code to identify errors or inconsistencies.
- Often involves collaboration with peers for a fresh perspective.
- Print Statements:
- Insert print statements to display variable values and program flow at runtime.
- Useful for identifying where the program deviates from expected behavior.
- Breakpoints:
- Use breakpoints to pause program execution at specific points.
- Allows inspection of variable values and program state during runtime.
- Step-Through Debugging:
- Execute the program one step at a time to observe behavior and identify errors.
- Commonly supported by IDEs.
- Logging:
- Record program events and variable values in log files.
- Facilitates error detection in complex systems or when debugging remotely.
- Rubber Duck Debugging:
- Explain the code and logic to an inanimate object (or another person).
- Helps clarify thought processes and identify errors overlooked during coding.
Tools for Debugging
- Integrated Debuggers:
- Built into IDEs like Visual Studio, Eclipse, and PyCharm.
- Provide features like breakpoints, variable inspection, and stack traces.
- Static Code Analyzers:
- Analyze the code for errors and potential issues without executing it.
- Examples: SonarQube, ESLint.
- Dynamic Analyzers:
- Monitor program execution to identify runtime errors.
- Examples: Valgrind, Heap analyzers.
- Online Debugging Tools:
- Platforms like Repl.it or JSFiddle allow collaborative debugging.
- Version Control Systems:
- Tools like Git help track changes and revert to earlier, error-free code versions.
Best Practices for Debugging
- Reproduce the Issue:
- Ensure the error can be consistently replicated.
- Helps narrow down potential causes.
- Isolate the Problem:
- Focus on the specific section of code causing the issue.
- Use modular testing to isolate faulty components.
- Understand the Code:
- Familiarize yourself with the program’s logic and dependencies.
- Review documentation and comments for context.
- Simplify the Code:
- Break complex code into smaller, testable units.
- Simplifies error detection and resolution.
- Test Incrementally:
- Test small code changes individually.
- Reduces the risk of introducing new errors.
- Document Findings:
- Record the cause and resolution of errors.
- Facilitates future debugging efforts.
Conclusion
Program implementation involves rigorous testing and debugging to ensure software correctness and reliability. By understanding error types, testing methods, and debugging techniques, developers can efficiently resolve issues and deliver robust programs. Adopting best practices and leveraging tools enhances the development process and minimizes time spent on error resolution.
Declaring Variables and Constants Using Elementary Data Types
In programming, variables and constants are essential components that store data. A clear understanding of elementary data types is crucial to ensure accurate and efficient program execution. Here’s an in-depth explanation of these concepts.
1. Variables
A variable is a storage location in memory that holds data, which can be modified during program execution. Variables are defined by:
- Data type: Specifies the kind of data the variable can hold (e.g., integer, string).
- Name/Identifier: A unique name to reference the variable in the program.
Declaration of Variables
To declare a variable:
- Specify its data type.
- Assign a name to the variable.
- Optionally, initialize it with a value.
Syntax Examples:
- In Python:
age = 25 # Implicit declaration with initialization
- In Java:
int age = 25; // Explicit declaration with initialization
- In C:
int age = 25; // Explicit declaration with initialization
2. Constants
A constant is a value that does not change during program execution. Constants are helpful for fixed values, such as PI
or tax rates, and improve code readability and maintainability.
Declaration of Constants
To declare a constant:
- Use a keyword like
final
,const
, or similar, depending on the programming language. - Assign a fixed value to it.
Examples:
- In Python:
PI = 3.14159 # Conventionally uppercase to indicate a constant
- In Java:
final double PI = 3.14159;
- In C:
#define PI 3.14159
3. Elementary Data Types
Elementary data types are the building blocks for declaring variables and constants. They are categorized based on the kind of data they store:
Integer (int)
- Used to store whole numbers, both positive and negative.
- Range depends on the system and programming language.
- Example:
int count = 10; // In Java
- Storage size:
- Typically 4 bytes in most programming languages.
Real/Double/Float
- Used for decimal or floating-point numbers.
- Double provides more precision than float.
- Example:
float temperature = 36.6f; // Float in Java double pi = 3.14159; // Double in Java
- Storage size:
- Float: 4 bytes
- Double: 8 bytes
Character (char)
- Stores a single character or symbol.
- Enclosed in single quotes (e.g.,
'A'
). - Example:
char grade = 'A'; // In Java
- Storage size:
- Typically 1 byte.
String
- Stores a sequence of characters.
- Example:
name = "John Doe" # In Python
- In some languages like C, strings are arrays of characters ending with a null character (
\0
).
Boolean/Logical
- Stores one of two values:
true
orfalse
. - Example:
boolean isActive = true; // In Java
- Stores one of two values:
4. Key Concepts in Data Types
Type Casting
- Converting one data type into another (e.g., integer to float).
- Example:
int x = 10; double y = (double) x; // Explicit casting
Type Inference
- Some languages (like Python) infer the data type based on the value assigned.
- Example:
count = 10 # Automatically inferred as an integer
Type Safety
- Ensures variables hold data of the declared type.
- Example:
int age = "twenty"; // Error in Java
5. Guidelines for Naming Variables and Constants
- Use meaningful names (e.g.,
age
,temperature
). - Avoid reserved keywords.
- Follow language conventions:
- CamelCase for variables in Java (
userName
). - Uppercase for constants (
PI
).
- CamelCase for variables in Java (
6. Practical Use Cases
- Integer: Counting items, storing ages, etc.
- Float/Double: Storing precise measurements like temperature.
- Character: Representing grades or single symbols.
- String: Representing names or messages.
- Boolean: Storing true/false conditions.
7. Memory Allocation
- Static: Fixed memory allocation during compile-time.
- Dynamic: Flexible memory allocation during runtime.
Programming Language Comparison
Exercises for Practice
- Declare variables of all elementary data types in your preferred language.
- Write a program to calculate the area of a circle using constants.
- Practice type casting between integer and float.
Program Implementation
Program implementation is a critical stage in software development where algorithmic statements are translated into high-level programming language constructs. This phase ensures that the logical steps devised during the problem-solving process are represented in a format understandable by computers. The process involves various fundamental concepts that programmers need to master, such as assignment statements, input/output operations, syntax for operators, conditional branching, and iteration. Each of these concepts is elaborated below.
Assignment Statements
Assignment statements are used to store values in variables. They form the basis of any program, allowing the programmer to manage and manipulate data. An assignment statement typically consists of a variable, an assignment operator (e.g., =
), and a value or expression to be assigned.
Example:
x = 10 # Assigning the value 10 to the variable x
name = "Alice" # Assigning the string "Alice" to the variable name
sum = a + b # Assigning the result of the expression a + b to the variable sum
Key Points:
- The left-hand side must always be a variable.
- The right-hand side can be a constant, variable, or expression.
- Assignment operators differ across languages (e.g.,
=
in Python and Java,:=
in Pascal).
Input/Output Operations
Input and output (I/O) operations allow a program to interact with users and external systems. These operations facilitate reading data entered by a user via a keyboard or displaying results on a monitor.
Input Operations
Input operations capture data from users and store it in variables. In most programming languages, specific functions or methods handle input.
Examples:
Python:
name = input("Enter your name: ") # Captures user input as a string age = int(input("Enter your age: ")) # Converts input into an integer
C++:
int age; cout << "Enter your age: "; cin >> age; // Captures input and stores it in the variable age
Output Operations
Output operations display information to the user. They include printing variables, strings, or computed results.
Examples:
Python:
print("Hello, World!") # Prints a string print("Your age is:", age) # Prints a string and a variable
C++:
cout << "Hello, World!" << endl; // Prints a string and moves to a new line cout << "Your age is: " << age << endl; // Prints a string and a variable
Key Points:
- Ensure proper data types for input (e.g., converting strings to integers if necessary).
- Outputs should be formatted for clarity.
Syntax for Arithmetic, Logic, and Relational Operators
Operators are symbols or keywords that perform operations on variables and values. These include arithmetic, logical, and relational operators, each serving distinct purposes.
Arithmetic Operators
Arithmetic operators are used to perform mathematical operations on numeric data types.
Logical Operators
Logical operators are used to combine or negate conditions, returning Boolean values (true/false).
Relational Operators
Relational operators compare values and return Boolean results.
Key Points:
- Ensure proper operator precedence (e.g., multiplication and division before addition and subtraction).
- Use parentheses to clarify complex expressions.
Syntax for Conditional Branching
Conditional branching allows a program to make decisions based on specific conditions. Common structures include if
, if-else
, nested if
, and case
statements.
Simple If Statement
Executes a block of code if a condition evaluates to true.
if condition:
# Code to execute
If-Else Statement
Provides an alternative code block if the condition evaluates to false.
if condition:
# Code if condition is true
else:
# Code if condition is false
Nested If-Else
Allows for multiple levels of decision-making.
if condition1:
# Code if condition1 is true
elif condition2:
# Code if condition2 is true
else:
# Code if neither condition1 nor condition2 is true
Case or Switch Statements
Used for multiple fixed value checks (available in languages like C++ and Java).
switch(expression) {
case value1:
// Code for value1
break;
case value2:
// Code for value2
break;
default:
// Code if no case matches
}
Key Points:
- Indentation is critical in languages like Python.
- Always include a default case in switch statements for unhandled inputs.
Syntax for Iteration (Loops)
Iteration allows repetitive execution of a block of code. Common loop structures include for
, while
, and repeat
loops.
For Loop
Executes a block of code a fixed number of times.
for i in range(5):
print(i) # Prints numbers 0 to 4
While Loop
Executes a block of code as long as a condition is true.
while condition:
# Code to execute
# Update condition to avoid infinite loops
Repeat/Do-While Loop
Executes a block of code at least once, then repeats as long as the condition is true (used in languages like C++).
do {
// Code to execute
} while (condition);
Key Points:
- Avoid infinite loops by ensuring conditions eventually evaluate to false.
- Use
break
andcontinue
statements for better loop control.
Conclusion
Understanding the translation of algorithmic statements into high-level programming syntax is fundamental for successful program implementation. Mastery of assignment statements, I/O operations, operators, conditional branching, and loops enables developers to create efficient, error-free programs. By practicing these concepts, programmers can build robust solutions to complex problems.
Effectively Document Programs
Program documentation is an essential aspect of software development that ensures clarity, maintainability, and usability of software solutions. Proper documentation enables developers, testers, and users to understand, maintain, and utilize programs effectively. Documentation can be categorized into two main types: internal and external. Both types serve different purposes but are equally important in ensuring the overall success of a software project.
Importance of Documentation
Clarity and Understanding: Documentation provides clarity regarding the program’s purpose, functionality, and usage. It bridges the gap between the developer’s intent and the end-user’s understanding.
Ease of Maintenance: Properly documented programs are easier to update, debug, and enhance. It enables new developers to understand the existing codebase without relying solely on the original developers.
Error Prevention: Clear documentation minimizes misinterpretation, reducing errors during implementation or usage.
Collaboration: In team environments, documentation facilitates better communication and collaboration among team members.
User Guidance: External documentation, such as user manuals, helps end-users navigate the software and utilize its features effectively.
Compliance and Standards: Many industries require proper documentation to meet regulatory and legal standards.
Features of Internal Documentation
Internal documentation refers to the information included within the source code of a program to aid developers in understanding and maintaining the code. Key features include:
1. Use of Mnemonics
- Mnemonics are meaningful names assigned to variables, functions, or procedures to make the code more understandable.
- Example: Instead of using variable names like
x
ory
, usetotal_sales
oruser_age
. - Benefits:
- Improves readability.
- Helps developers understand the purpose of the variables or functions.
2. Meaningful Variable Names
- Variable names should be descriptive and convey the purpose or content of the variable.
- Example: Instead of
int a
, useint number_of_students
. - Best Practices:
- Use camelCase or snake_case for naming variables (e.g.,
totalRevenue
,user_input
). - Avoid abbreviations or single-letter variable names unless their meaning is universally understood.
- Use camelCase or snake_case for naming variables (e.g.,
3. Use of Comments
- Comments explain the purpose of specific sections of code, making it easier to understand and maintain.
- Types of comments:
- Single-line comments: Begin with
//
in languages like C++, Java, or JavaScript. - Multi-line comments: Enclosed within
/* ... */
.
- Single-line comments: Begin with
- Best Practices:
- Write comments for complex logic or algorithms.
- Avoid redundant comments that restate obvious code.
- Keep comments concise and to the point.
4. Indentation
- Proper indentation visually separates blocks of code, making the structure of the program clearer.
- Example:
if condition: execute_action() if nested_condition: execute_nested_action()
- Best Practices:
- Use consistent indentation (e.g., 2 spaces, 4 spaces, or a single tab).
- Follow the coding standards of the programming language.
5. Effective Use of White Space
- White space refers to blank lines or spaces used to separate code blocks or statements.
- Benefits:
- Enhances readability.
- Improves the visual structure of the program.
- Best Practices:
- Leave a blank line between logical sections of code.
- Avoid excessive white space that can clutter the program.
Features of External Documentation
External documentation refers to materials provided alongside the software to assist users and developers in understanding the software’s functionality and usage. Common forms of external documentation include user manuals, API documentation, and technical guides.
1. User Manual
- A user manual is a comprehensive guide that provides instructions on how to install, configure, and use the software.
- Key Sections:
- Introduction: Overview of the software, its purpose, and key features.
- Installation Guide: Step-by-step instructions for installing the software on various platforms.
- Configuration: Guidance on setting up the software according to user requirements.
- Usage Instructions: Detailed explanations of how to use each feature of the software.
- Troubleshooting: Solutions to common issues or errors.
- Best Practices:
- Use simple and clear language.
- Include screenshots or diagrams for visual clarity.
- Organize content into sections with a table of contents for easy navigation.
2. API Documentation
- API documentation is provided for developers to understand how to interact with the software’s Application Programming Interface (API).
- Key Elements:
- Endpoints: List of available API endpoints and their purposes.
- Parameters: Details of required and optional parameters for each endpoint.
- Response Formats: Examples of responses, including success and error messages.
- Code Examples: Sample code snippets demonstrating API usage.
- Best Practices:
- Use consistent formatting.
- Provide examples in multiple programming languages if possible.
- Include error codes and their meanings.
3. Technical Documentation
- This type of documentation is aimed at developers or system administrators and includes detailed information about the system architecture, design, and implementation.
- Key Sections:
- System Requirements: Hardware and software prerequisites.
- System Architecture: Description of the system’s structure and components.
- Data Models: Diagrams or descriptions of database schemas and relationships.
- Version Control: Documentation of version history, changes, and updates.
- Best Practices:
- Keep the content up to date with each release.
- Use diagrams and flowcharts to explain complex concepts.
Best Practices for Program Documentation
Plan Documentation Early: Start documenting during the initial phases of development to ensure all aspects are covered.
Use Standardized Formats: Follow industry standards or organizational guidelines for documentation.
Keep Documentation Updated: Regularly update the documentation to reflect changes or enhancements in the program.
Incorporate Visuals: Use diagrams, flowcharts, and screenshots to make the documentation more engaging and easier to understand.
Simplify Language: Avoid technical jargon unless necessary; use simple and clear language that is accessible to the target audience.
Test Documentation: Have end-users or developers review the documentation to ensure it is comprehensive and understandable.
Conclusion
Effective documentation is crucial for the success and longevity of software programs. By adhering to the principles of internal and external documentation, developers can create software that is not only functional but also maintainable, scalable, and user-friendly. Whether through meaningful variable names, well-written comments, or comprehensive user manuals, proper documentation enhances the overall quality of the software and ensures it meets the needs of its users and maintainers.
The above content covers the complete CSEC Information Technology syllabus. If any copyrighted material, please contact us at our email: contact@globelearners.com